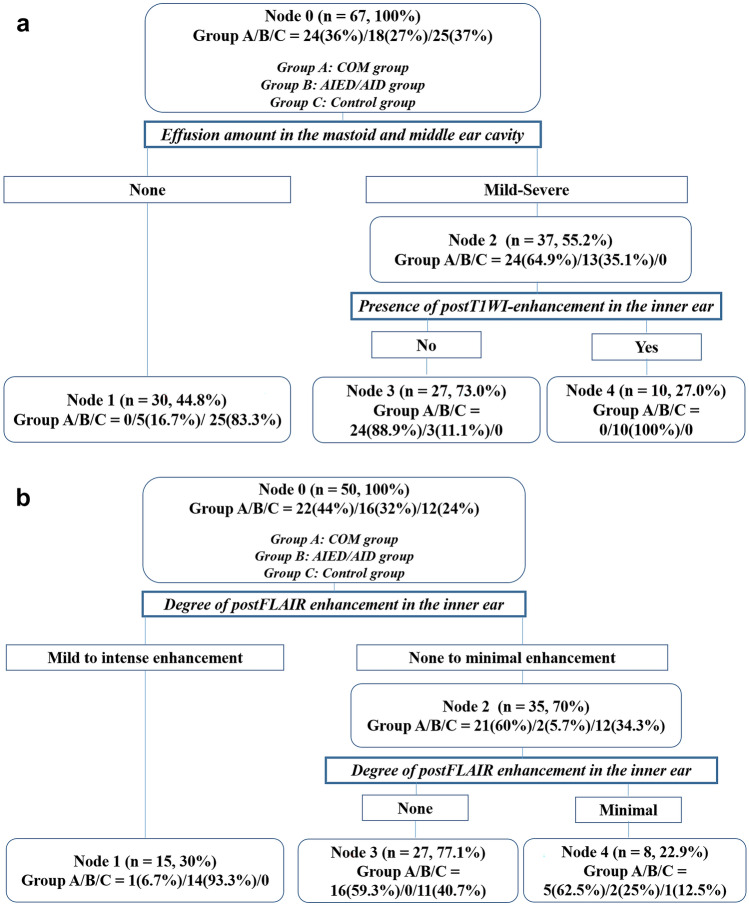
Figure 2.
Classification and regression tree analysis (CART) results. The first decision-making tree (a) uses two nodes of the amount of effusion in the mastoid and middle ear cavity and the presence of enhancement in the inner ear structures on post-contrast T1-weighted images (postT1WI). The second decision-making tree (b) utilized the degree of enhancement in the inner ear structures on post-contrast FLAIR images (postFLAIR) as the partitioning node. Group A was the chronic otitis media (COM) group, group B was the autoimmune inner ear disease and autoinflammatory inner ear disease (AIED/AID) group, and group C was the control group. The details regarding the tree are explained in the “Results” section.

