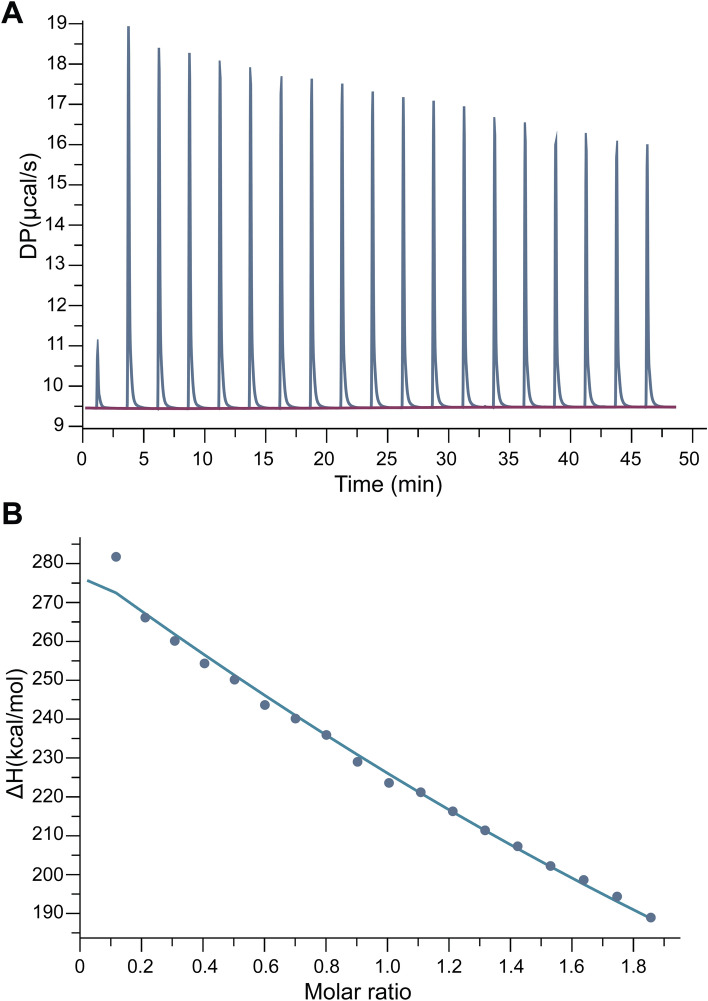
Figure 5.
Isothermal titration calorimetric (ITC) profile of the binding between CCM and NTCP. The titration of raw data between differential power (DP, µcal/s) and time (min) after sequential injection of ligand (150 μM CCM) into the protein solution (15 μM of NTCP, pH 7.0, 25 °C) was plotted (A). The integrated heat after the correlation between enthalpy changes versus the molar ratios of CCM (injection) to protein (NTCP) was plotted (B). Data were fitted using a one-site binding model where the solid lines represented the best-fit results.

