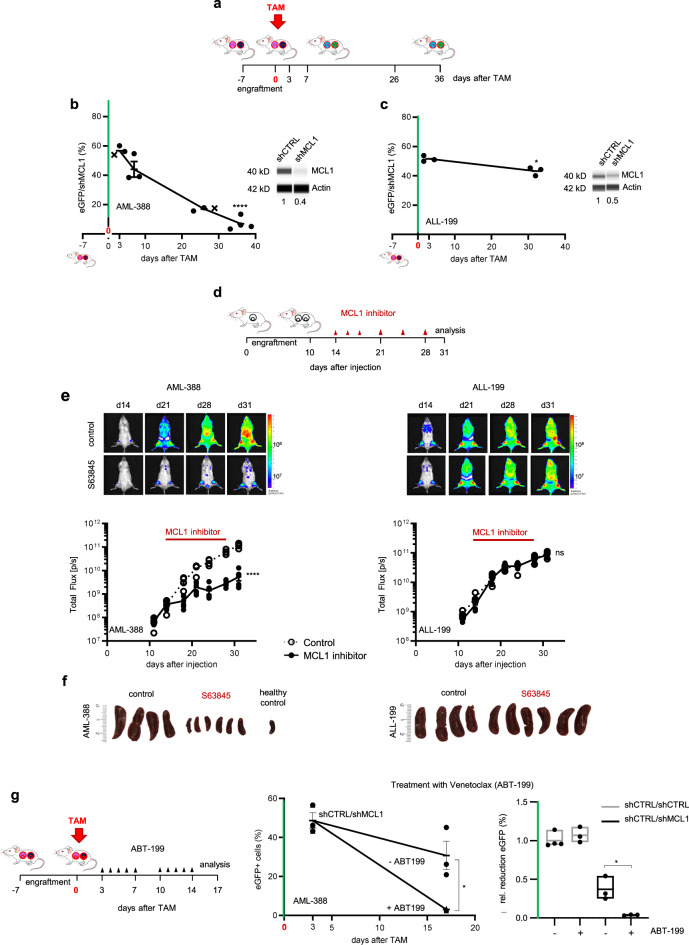
Fig. 2. Inducible knockdown of MCL1 in vivo predicts response of AL PDX to pharmacological MCL1 inhibition.
a–c Inducible knockdown of MCL1 in AL PDX. a Scheme depicting the experimental setup. Groups of mice were injected with the shCTRL/shMCL1 mixture for competitive in vivo assays (3×10⁵ cells/mouse). TAM was administered when tumors were established; differences between eGFP-positive shMCL1 cells among all recombined cells were determined 3 days after TAM and at end stage leukemia to assess essentiality of MCL1. b–c Competitive experiments were set up as described in a; TAM (50 mg/kg) was applied once (day 0); mice bearing (b) AML-388 PDX cells were sacrificed 3 (n = 3), 7 (n = 3), 26 (n = 3) and 36 (n = 4) days after TAM; mice bearing ALL-199 PDX cells were sacrificed 3 (n = 3) and 32 (n = 3) days after TAM. MCL1 protein expression was analyzed in sorted shCTRL and shMCL1 populations by protein immunoassay (Simple Western) 7 days after TAM (AML-388) or at the experimental endpoint (ALL-199). Mean ± SEM of the proportion of eGFP-positive cells isolated out of all recombined cells is displayed; each dot represents one mouse; x marks mice shown in Fig. 1c. To determine significance of depletion of shGOI-expressing cells, the percentage of eGFP/shGOI cells at the experimental endpoint is compared to the percentage of eGFP/shGOI cells at 3d post TAM, as this time point is used to define the sample-specific recombination efficiency. *p = 0.0136, ****p < 0.0001, ns not significant by unpaired t-test. d–f Pharmacological inhibition of MCL1 in AL PDX. d Scheme depicting the experimental setup. Groups of mice were injected with AML-388 (left; 3×10⁵ cells/mouse, n = 10) or ALL-199 (right; 1×10⁶ cells/mouse, n = 10) PDX cells expressing firefly luciferase. 14 days after injection, mice were treated with the small molecule MCL1 antagonist S63845 (mice received 25 mg/kg three times in the first week, 12.5 mg/kg twice in the second week, and once in the third week, n = 6) or solvent as control (n = 4) and tumor growth was monitored by bioluminescence in vivo imaging until mice were sacrificed 31 days after injection. e Representative bioluminescence images are depicted and graph shows mean ± SEM; ****p < 0.0001, ns not significant by unpaired t-test. f Images of spleens of control- or S63845-treated mice are displayed. One spleen of a healthy mouse without leukemia (healthy control) is shown for comparison. g The combinatorial effect of MCL1 knockdown plus ABT-199 (Venetoclax) was studied by injecting mice with a 1:1 mixture of shCTRL/shMCL1 AML-388 cells (3×10⁵ cells/mouse) and treating them with 50 mg/kg TAM, 7 days after injection (day 0). 3d after TAM administration, control mice were sacrificed (n = 3) and the remaining mice treated either with 100 mg/kg ABT-199 (n = 3) or solvent (n = 3) for 5 consecutive days per week, in 2 cycles. At the end of the experiment (17 days after TAM), mice were sacrificed and analyzed as in Fig. 1c. Mean ± SEM is shown; *p = 0.0194 by unpaired t-test. Reduction of eGFP-positive cells in the shCTRL/shMCL1 mix relative to shCTRL/shCTRL (+/- ABT-199) is displayed. Each dot represents one mouse. Mean ± SEM is shown; *p = 0.0194 by unpaired t-test.

