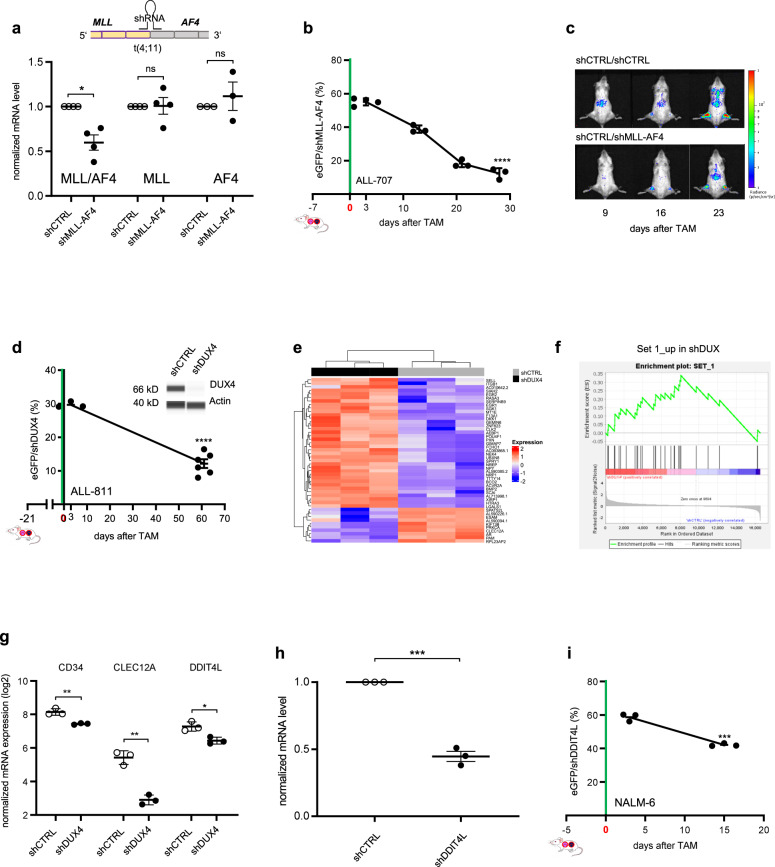
Fig. 3. Essential function of MLL-AF4 and DUX4-IGH fusion proteins in rearranged ALL.
a–c MLL-AF4 plays an essential role in vivo in MLL-AF4 rearranged ALL. a A shRNA targeting the MLL-AF4 fusion mRNA was designed, according to the patient’s specific breakpoint of PDX ALL-707 (Table S3). mRNA expression of MLL-AF4, MLL and AF4 in PDX ALL-707 was analyzed by qPCR in CTRL and MLL-AF4 knockdown cells (n = 3 each). Mean ± SEM of cells isolated from mice 28 days after TAM are shown. *p = 0.0178 by Welch’s t-test; ns not significant. b Competitive experiments were performed and analyzed as in Fig. 1c, using PDX ALL-707 cells and the shGOI targeting MLL-AF4. TAM was applied on two consecutive days (100 mg/kg, day −1 + 0). Mice were sacrificed 3 (n = 4), 13 (n = 3), 21 (n = 3) and 28 (n = 3) days after TAM; each dot represents one mouse; mean ± SEM; ****p < 0.0001, by unpaired t-test. c Representative in vivo bioluminescence images of mice bearing a shCTRL/shCTRL or shCTRL/shMLL-AF4 mixture from the experiment described in Fig. 3b, at the indicated time points after TAM administration. d–g DUX4 plays an essential role in DUX4-IGH rearranged ALL. d Competitive experiments were performed and analyzed as in Fig. 2b, using ALL-811 and the shRNA targeting DUX4 (1.4×10⁶ cells/mouse). 21 days after injection, TAM (50 mg/kg) was applied once (day 0). Mice were sacrificed 3 (n = 3) and 61 (n = 6) days after TAM. Shown is mean ± SEM. ****p < 0.0001 by unpaired t-test. Protein immunoassay of DUX4 in NALM-6 cells, after lentiviral transduction with the indicated shRNAs. β-actin was used as loading control. e Transcriptome analysis was performed from eGFP/shCTRL and eGFP/shDUX4 cells from the experiment described in panel d 82 days after TAM (n = 3 for each condition). Heatmap of 47 genes differentially expressed between the two groups is shown. All gene expressions have been scaled to a mean value of 0 and a variance of 1. f Enrichment plot of genes deregulated in shDUX4 PDX cells compared to genes upregulated two-fold (Set 1) in a published transcriptomic signature (Tanaka et al.43) generated from NALM-6 cells expressing shDUX4. NES = 2.19 (FDR q-value < 0.002). g Mean ± SEM (n = 3 independent animals for shCTRL or shDUX4) of three differentially expressed genes are depicted; **p = 0.0040 for CD34, **p = 0.0011 for CLEC12A and *p = 0.0145 for DDIT4L by unpaired t-test. h, i DDIT4L inhibition partially phenocopies DUX4 silencing. h mRNA expression of DDIT4L in NALM-6 was analyzed by qPCR in CTRL and DDIT4L knockdown cells (n = 3 each). Mean ± SEM of cells isolated 7 days after TAM are shown. ***p < 0.001 by unpaired t-test. i Competitive experiments were performed and analyzed as in Fig. 2b, using the NALM-6 cell line and the shRNA targeting DDIT4L (5×10⁶ cells/mouse (for day 3) and 1×10⁵ cells/mouse (for day 15)). 5 days after injection, TAM (50 mg/kg) was applied once (day 0). Mice were sacrificed 3 (n = 3) and 15 (n = 3) days after TAM. Shown is mean ± SEM. ***p = 0.0003 by unpaired t-test.

