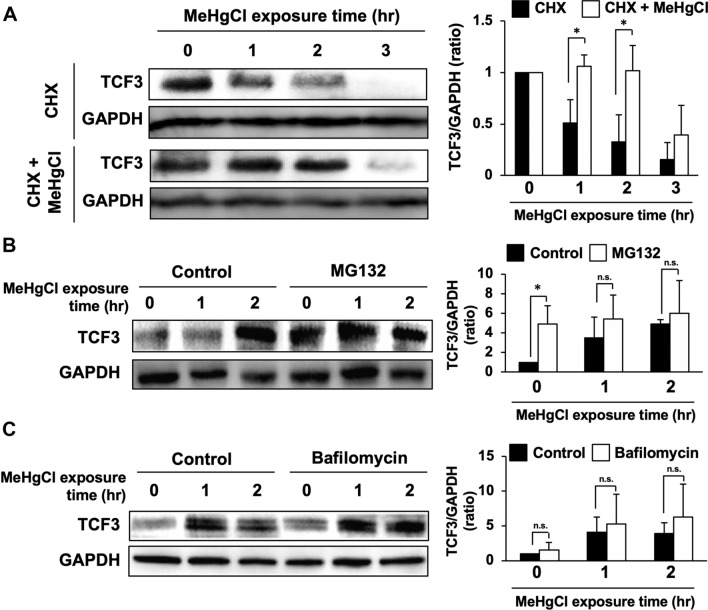
Fig. 3.
Effects of inhibition of proteolytic pathways on increase in TCF3 protein levels by methylmercury. a C17.2 cells were pretreated with 40 µM of cycloheximide (CHX) for 1 h and 20 µM of methylmercuric chloride (MeHgCl) for the indicated time course. Protein levels of TCF3 and GAPDH were determined by immunoblotting. A representative blot is shown in the left panel. Right panel indicates quantification of TCF3 band intensities that have been corrected by GAPDH (n = 3). b C17.2 cells were pretreated with 30 µM of MG132 for 4 h and 20 µM of MeHgCl for the indicated time course. Protein levels of TCF3 and GAPDH were determined by immunoblotting. A representative blot is shown in the left panel. Right panel indicates quantification of TCF3 band intensities that have been corrected by GAPDH (n = 3). c C17.2 cells were pretreated with 0.5 µM of bafilomycin for 3 h and 20 µM of MeHgCl for the indicated time course. Protein levels of TCF3 and GAPDH were determined by immunoblotting. A representative blot is shown in the left panel. Right panel indicates quantification of TCF3 band intensities that have been corrected by GAPDH (n = 3). The data are represented as mean ± SD. *p < 0.05 vs. control. n.s. indicates not significant

