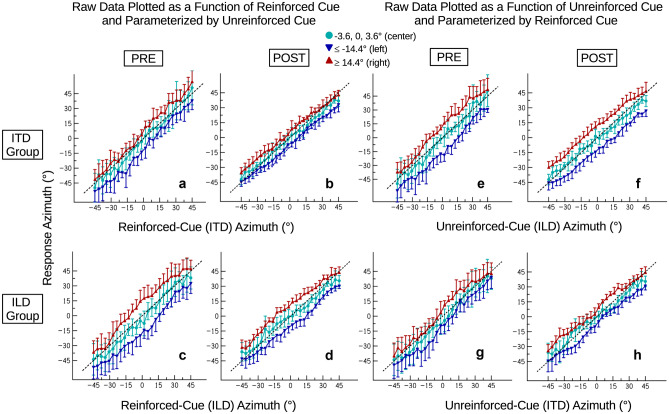
Fig. 3.
An overview of mean response azimuths across participants as a function of either reinforced-cue azimuth (ITD azimuth for the ITD group, ILD azimuth for the ILD group; panels a–d, left-hand side) or unreinforced-cue azimuth (ILD azimuth for ITD group, ITD azimuth for ILD group; panels e–h, right-hand side). The data are parameterized by the offset of the cue not shown on the x-axis from the cue shown on the x-axis, pooling across three offset ranges: central offsets (−3.6°, 0°, and 3.6°, cyan circles), leftward offsets (≤ 14.4°, blue downward-pointing triangles) or rightward offsets (≥ 14.4°, red upward-pointing triangles). In each panel pair, the panel on the left shows the pretest and the panel on the right shows the posttest. Error bars indicate standard deviations

