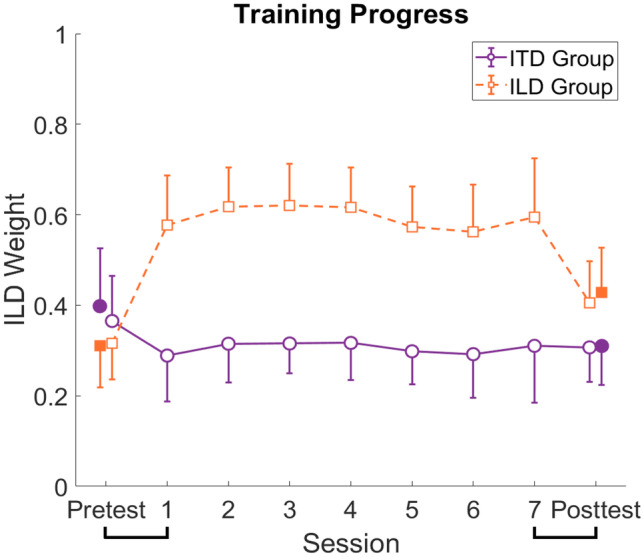
Fig. 6.

Training progress. ILD weights calculated by limiting the combinations considered for azimuths more lateral than 19.8° to ensure balanced distributions are shown for the pretest, the seven training sessions and the posttest. Purple circles show the results for the ITD group, orange squares for the ILD group. For comparison, the pre- and posttest weights calculated using all data are shown as separate symbols at the far left and far right of the figure. Error bars show standard deviations
