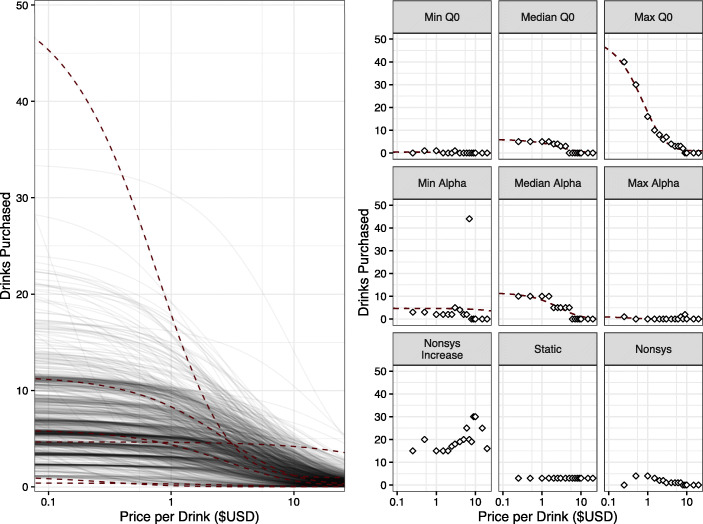
Fig. 3.
Results from the First Stage Model Fitting from the Two-Stage Approach. Note: Left panel: Individual best fit lines in gray and subset of participants' best fit lines from right panel in maroon dashed line. Note here because of this approach, no overall group-level best fit curve is generated. Right panel: A subset of participants and their responses. The maroon dashed lines show best fit lines for each participant. As illustrated in the bottom three panes, one of the limitations of the two-stage approach is that irregular datasets often times do not yield usable demand metrics. In these cases, no model predictions are obtained and demand parameters from these models cannot be used in subsequent analyses

