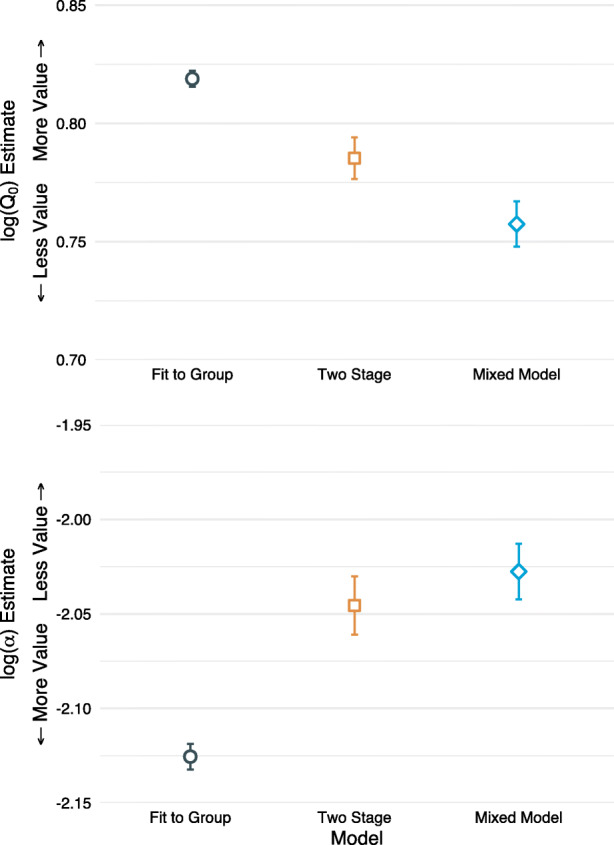
Fig. 5.

Point Estimates and Standard Errors for log(Q0) (Top Panel) and log(α) (Bottom Panel) from Each of the Three Fitting Methods. Note: Notice how for this dataset, the fit-to-group approach (circles) tend to underestimate standard errors whereas the two-stage approach (squares) standard errors are larger. The mixed-effects modeling approach is shown in diamonds
