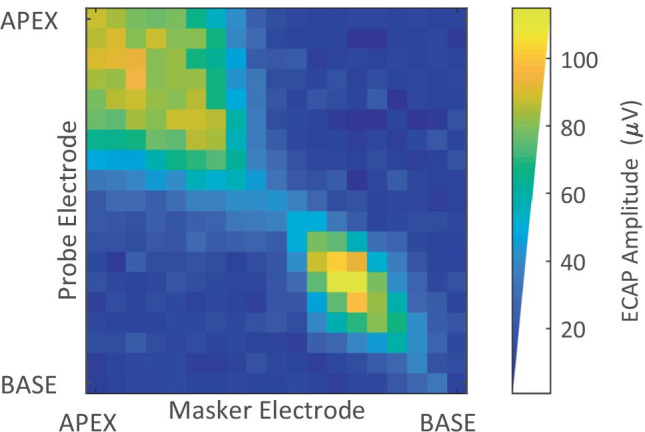
Fig. 2.

An example of the PECAP matrix measured for a CI participant (C03), each cell of which represents the amplitude of an ECAP waveform in µV, recorded using all possible combinations of probe and masker electrodes from base to apex. It can be seen that the ECAP amplitudes are highest along the diagonal of the matrix for which probe and masker are placed on the same electrode, thereby maximising the overlap in neural excitation area
