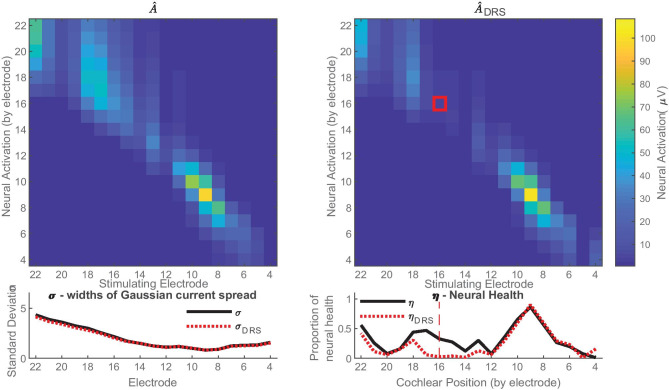
Fig. 9.
Neural dead region simulation results for participant C03. In the top left, the matrix for neural excitation patterns which PECAP estimates for the standard condition, and in the top right, the matrix which PECAP estimates for the neural dead region simulation condition. The neural dead region was simulated for this participant at electrode 16, as indicated by the red box. The graph in the bottom left indicates PECAP estimation of current spread (σ) was consistent between the standard condition (black, straight line) and the neural dead region simulation condition (red, dotted line). The graph in the bottom right shows PECAP estimation of neural health (ƞ) for both conditions. Poorer estimated neural health is apparent for the neural dead region simulation in comparison to the standard condition from electrodes 13 to 18, but estimates were largely consistent between the two conditions for the other electrodes

