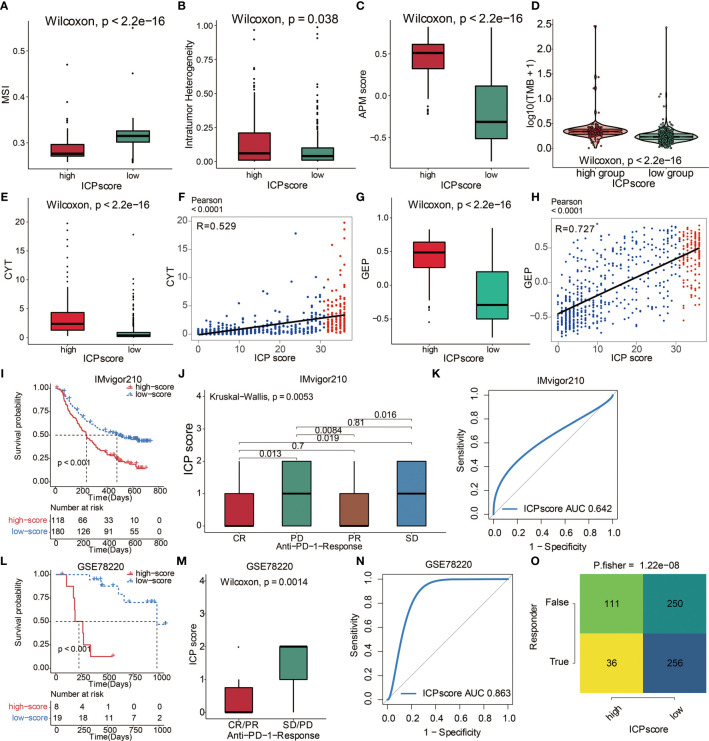
Figure 7.
The predictive value of ICP score in immunotherapy. (A) MSI score in high and low ICP score. (B) APM score in high and low ICP score. (C) Intratumor Heterogeneity in high and low ICP score. (D) TMB expression differences in high and low ICP score. Differences between groups were compared through the Wilcoxon test (Wilcoxon, P < 0.001). (E) CYT and (G) GEP expression differences in high and low ICP score. Differences between groups were compared through the Wilcoxon test (Wilcoxon, P < 0.001). Scatter plots depicting a positive correlation between ICP score and (F) CYT and (H) GEP. Pearson Correlation Coefficient R = 0.529 and 0.727, respectively. (I) Kaplan–Meier curves for the two ICP score groups in the IMvigor210 dataset. Log-rank test, P < 0.001. (J) ICP score in groups with different anti–PD-1 clinical response status (CR, PR, SD, PD). Differences between groups were compared by Kruskal-Wallis test (Kruskal-Wallis, P = 0.0053). (K) ROC curve measuring the sensitivity of ICP score in predicting the survival status of patients in the IMvigor210 dataset. The area under the ROC curve was 0.642. (L) Kaplan–Meier curves for the two ICP score groups in the GSE78220 dataset. Log-rank test, P < 0.001. (M) ICP score in groups with different anti–PD-1 clinical response status (CR/PR and SD/PD). Differences between groups were compared by Wilcoxon test (Wilcoxon, P = 0.0014). (N) ROC curve measuring the sensitivity of ICP score in predicting the survival status of patients in the GSE78220 dataset. The area under the ROC curve was 0.863. (O) TIDE value and response to immunotherapy of patients with ICP score. Fisher’s test, P < 0.001.

