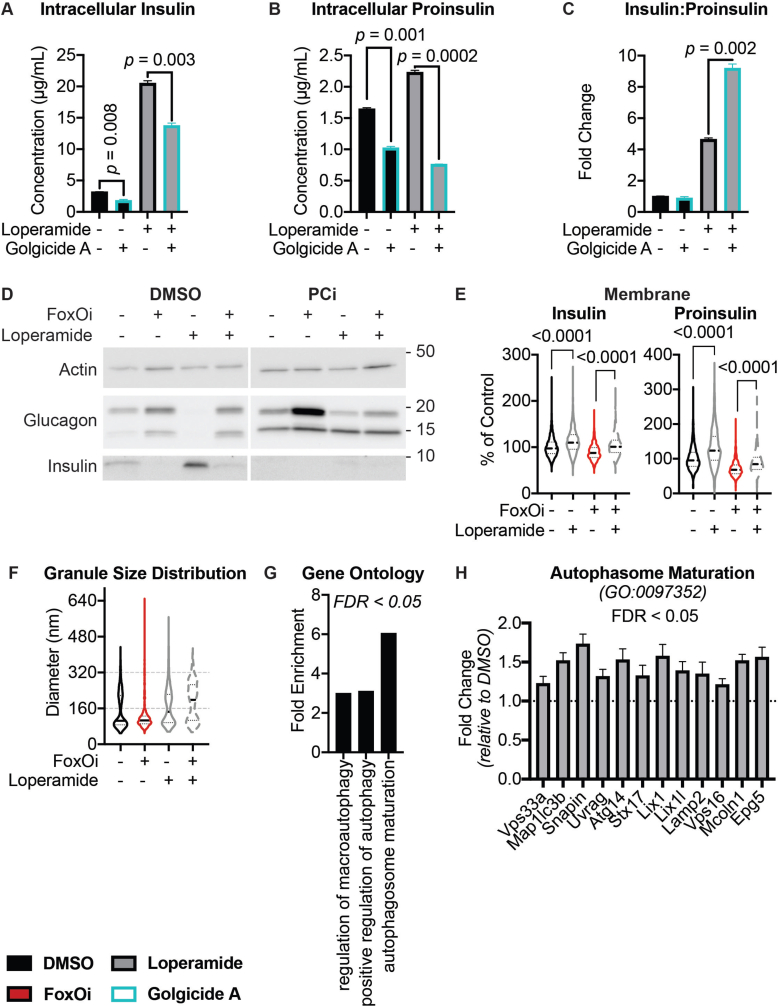
Supplementary Figure 10.
A-B. Intracellular insulin and proinsulin protein levels after 30 h loperamide treatment +/− 10 μM Golgicide A for the final 6 h, as measured by ELISA. C. Ratio of insulin to proinsulin protein levels. D. Western blot for glucagon and insulin protein levels in Min6 cells after 48 h FoxOi/loperamide/PCi treatment. E. Quantification of insulin and proinsulin immunofluorescence intensities at the cell plasma membrane after 48 h loperamide and FoxOi treatment. Plasma membrane defined using Harmony 4 (PerkinElmer) software. F. Quantification of insulin granule size distribution from electron microscopy images. N = 5 cells per treatment condition. G. Gene ontology enrichment terms for RNAseq dataset of genes significantly upregulated by loperamide after 48 h treatment in Min6 cells. H. Significantly upregulated genes involved in autophagosome maturation following 48 loperamide treatment in Min6 cells.

