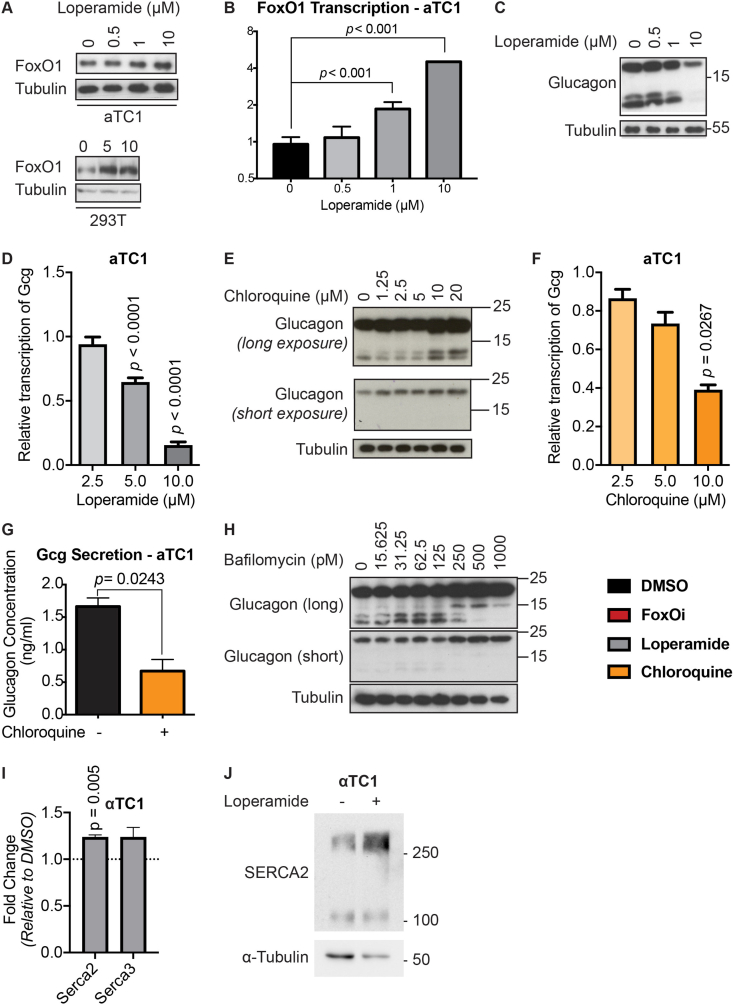
Supplementary Figure 12.
A-D. Effects of loperamide treatment on FoxO1 and glucagon levels in alpha cells. A. Western blot showing an increase of FoxO1 protein with loperamide treatment in alpha and HEK cells. B. FoxO1 transcription at different concentrations of loperamide in alpha cells, measured via RT-qPCR. C. Western blot showing decrease of glucagon protein with different concentrations of loperamide in alpha cells. D. Suppression of glucagon transcription by increasing doses of loperamide in alpha cells. E-G. Effects of chloroquine treatment on glucagon in alpha cells. E. Western blot showing changes to glucagon protein expression in alpha cells following 24h chloroquine treatment. F. Chloroquine suppresses glucagon transcription in alpha cells in a dose dependent manner. G. Glucagon secretion from alpha cells in low glucose medium pretreated with chloroquine (5 μM) for 24 h, concentration measured by ELISA. H. Western blot of glucagon gene protein products in alpha cells treated with different doses of bafilomycin (V-ATPase inhibitor) overnight. I. Increase in Atp2a2 and Atp2a3 mRNA levels in alpha cells after 24 h loperamide treatment. J. Western blot highlighting increase in SERCA2 protein in alpha cells after 24 h loperamide treatment.

