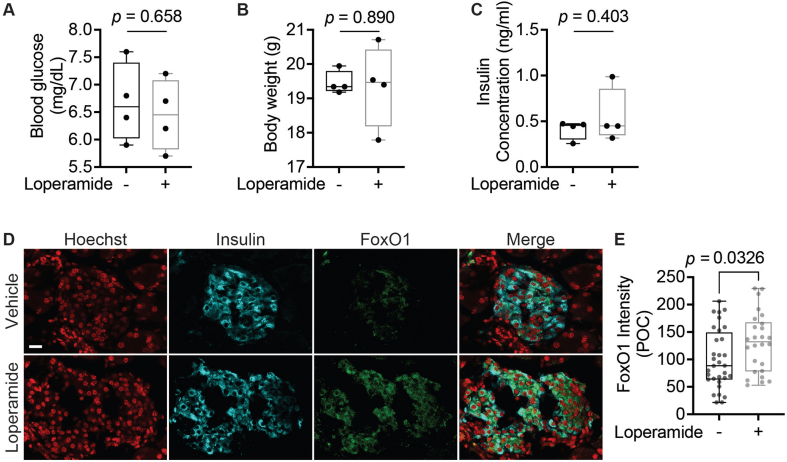
Supplementary Figure 14.
A-C. Results of 4-week loperamide treatment in wild-type non-diabetic mice. N = 4 mice/treatment. A. Serum glucose concentrations after overnight fast. B. Body weight. C. Serum insulin concentration measured by ELISA. D. Representative immunofluorescence panel of db/db mouse pancreas sections 4-weeks post loperamide treatment, stained for insulin and FoxO1. Scale bar = 20 μm. E. Quantification of immunofluorescence images. FoxO1 intensity was only calculated within insulin-positive cells. POC = percent of control. NDMSO = 32 islets and NLoperamide = 26 islets from five different mice each.

