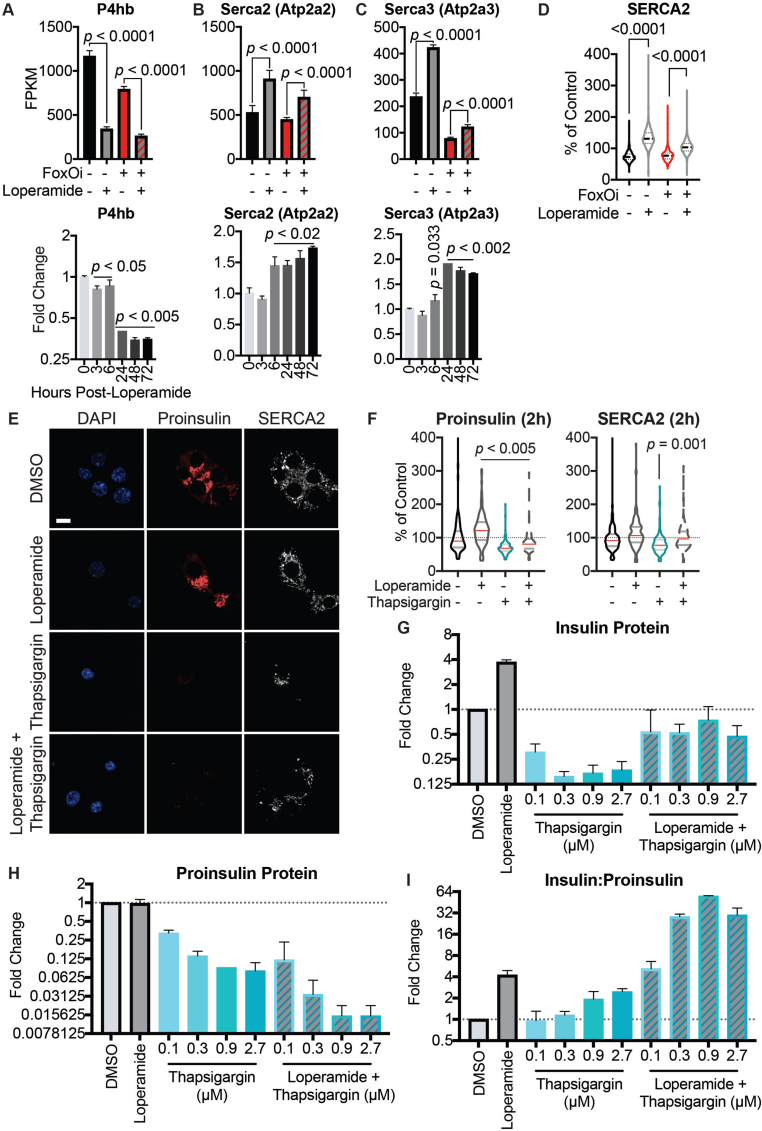
Supplementary Figure 9.
A-C. Top: RNAseq expression levels after 48h treatment; Bottom: RT-qPCR time course of mRNA levels for A. P4hb. B. Atp2a2. C. Atp2a3. D. Quantification of SERCA2 immunofluorescence intensity in Min6 cells treated with loperamide and FoxOi for 48h. E. Representative immunofluorescence images of Min6 cells treated with loperamide and thapsigargin for 2 h. Scale bar = 10 μm. F. Quantification of proinsulin and SERCA2 immunofluorescence intensity in Min6 cells treated with loperamide and thapsigargin for 2 h. G-H. Protein levels of mature insulin or proinsulin in Min6 cells after 24h treatment with varying concentrations of thapsigargin +/− loperamide, as measured by ELISA. I. Ratio of insulin to proinsulin protein levels.

