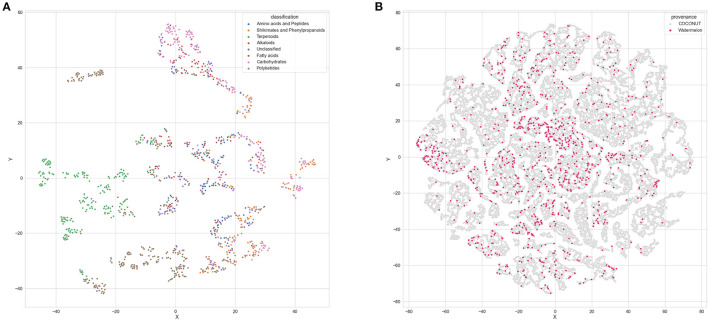
Figure 11.
Graphical representation of the chemical space covered by watermelon natural products. (A) t-SNE plot of the known watermelon chemical space. Every point represents one molecule with points colored by their chemical class. (B) t-sne plot of the watermelon compounds (in red) within the known natural products chemical space (in gray).

