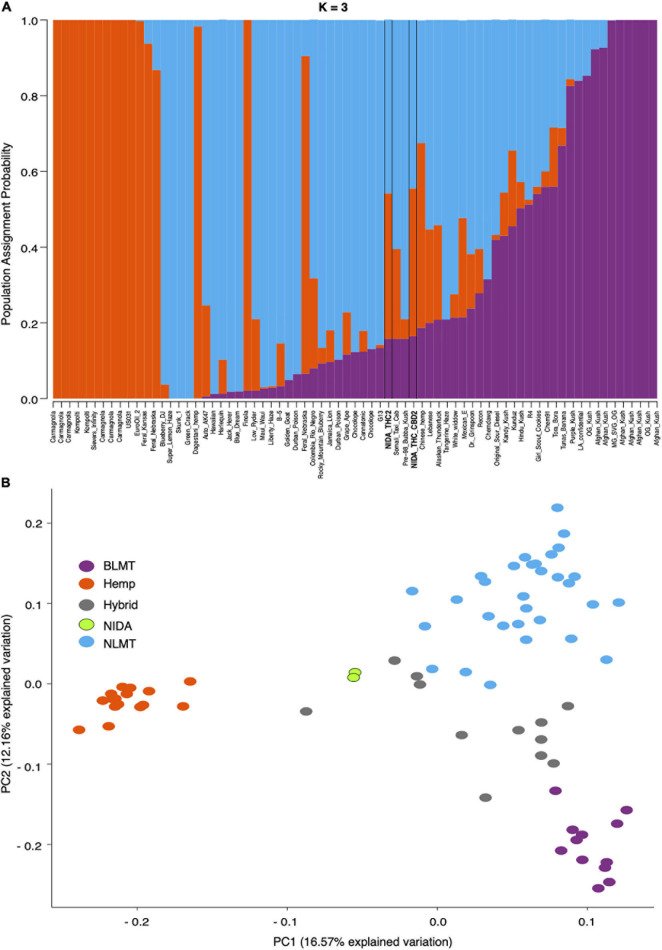
FIGURE 1.
STRUCTURE and Principal Component Analyses. Proportion of each color in the bar indicates the probability of assignment to Hemp (orange), NLMT (blue), or BLMT (purple), groups. Both of NIDA’s strains outlined with black margins are assigned to both NLMT and Hemp groups with less than 60% probability, and therefore we assigned them to the Hybrid group (A). The two NIDA samples in green cluster with each other and away from other varieties (B).

