Fig. 1.
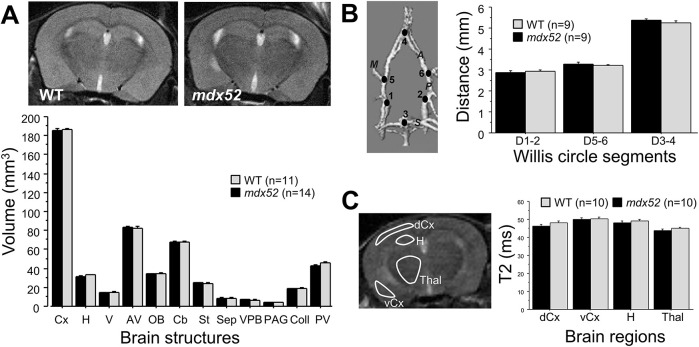
In vivo MRI structural analyses. (A) Top images are representative MRI coronal sections and the histogram below shows the volumes (mm3) of the analyzed brain structures, as defined in Table 1. MRI volumetric analyses are shown in the histogram for wild-type (WT, grey bars) and mdx52 mice (black bars). (B) Angiographic estimation of the length of the main cerebral arteries. The three-dimensional image shows the medial (M), anterior (A), posterior (P) and superior (S) arteries, and the six points defined around the Willis circle used to quantify distances (D) between the points (in mm) D1 and D2, D5 and D6, and D3 and D4 in the histogram (right). (C) T2 maps generated at Bregma −1 mm in four brain regions shown in the sample MRI coronal image on the left: dorsal (primary sensory) and ventral (piriform) cortex layers (dCx and vCx, respectively), hippocampus (H) and thalamic nuclei (Thal). T2 quantifications are shown in the histogram (right). Data are mean±s.e.m. Statistics undertaken with two-way ANOVA for repeated measures were all insignificant (P>0.05).

