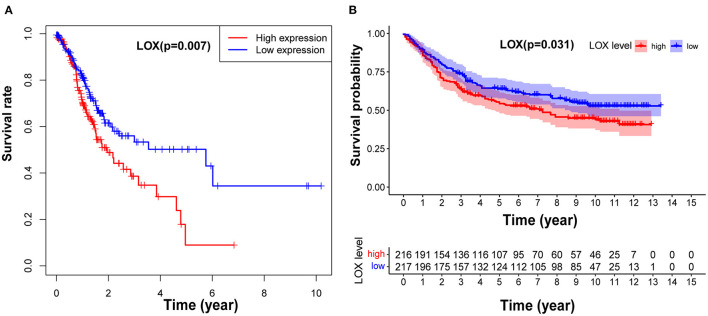
Figure 2.
LOX impact on the overall survival of patients with GC. (A) Kaplan-Meier curve was used to analyze the relationship between LOX mRNA expression and prognosis of GC patients based on TCGA data (p = 0.007). (B) Kaplan-Meier curve was used to analyze the relationship between LOX mRNA expression and prognosis of GC patients based on GEO data (p = 0.031). TCGA, The Cancer Genome Atlas; GEO, the Gene Expression Omnibus.

