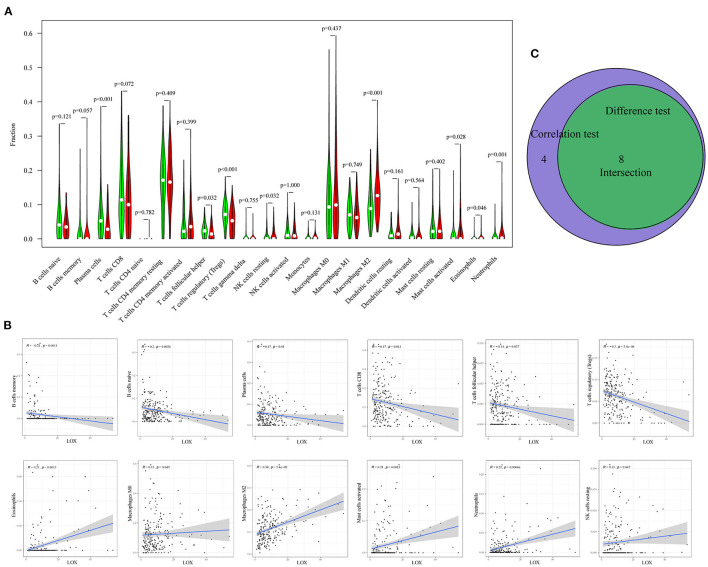
Figure 8.
Correlation between TIC ratio and LOX expression. (A) The violin chart shows the proportional difference between the LOX high and low expression groups and 22 TICs (Wilcoxon rank-sum test). (B) The Scatter diagram shows the correlation between LOX expression and the proportion of TIC in 12 (Pearson coefficient test). (C) Venn diagram shows that 8 TICs are related to LOX expression. The intersection of the difference and correlation test is shown in the violin chart and the scatter chart.

