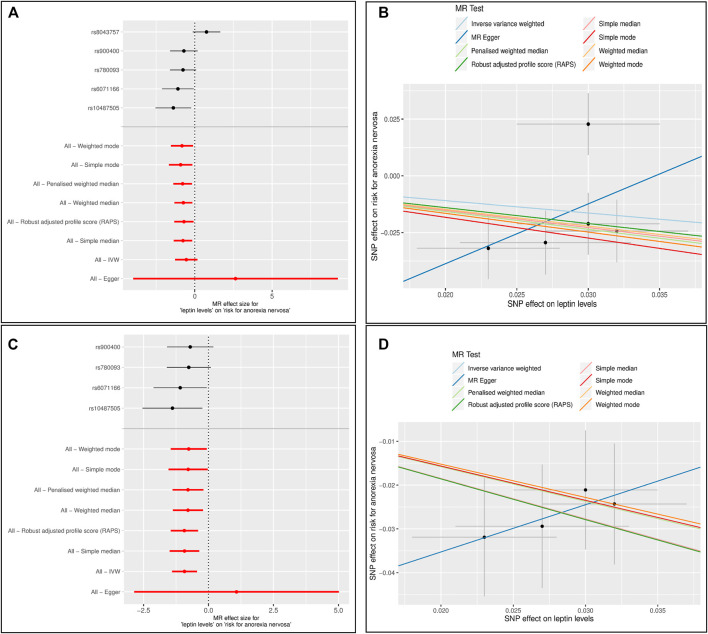
FIGURE 1.
Results of the single and multiple-SNP Mendelian randomization (MR) analyses for effect of leptin levels (Kilpeläinen et al., 2016) on risk for anorexia nervosa (AN) (Watson et al., 2019). The black lines in forest plots (left side) visualize the results of single SNP analyses; the red lines visualize the results of the multiple SNP analysis. In scatter plots (right side) the slopes of each line represent the causal association for different MR method (A) and (B): Instrument Variable (IV): 5 SNPs associated with unadjusted leptin levels (C) and (D): Instrument Variable (IV): 4 SNPs associated with unadjusted leptin levels. The SNP rs8043757 (FTO) was excluded.

