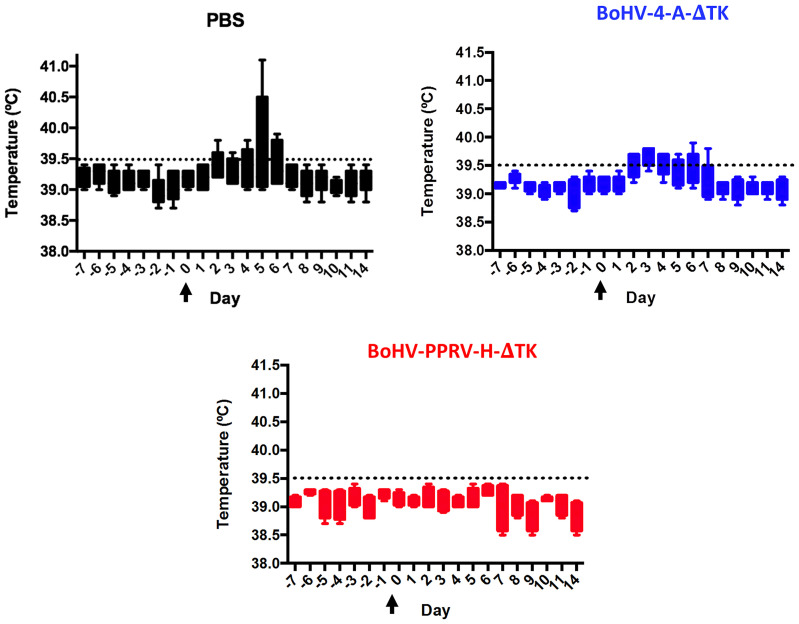
Figure 2.
Rectal temperature in immunized sheep. The temperatures from day 38 (day −7) of the experiment to day 14 PC are represented in a box and whiskers plot that shows the minimum to maximum values in a box. As indicated, each panel corresponds to each experimental group of animals. Arrows indicate the day of ICV’89 PPRV challenge (day 0). The threshold temperature value above which animals were considered to have fever (39.5°C) is indicated as a dashed line in each panel.

