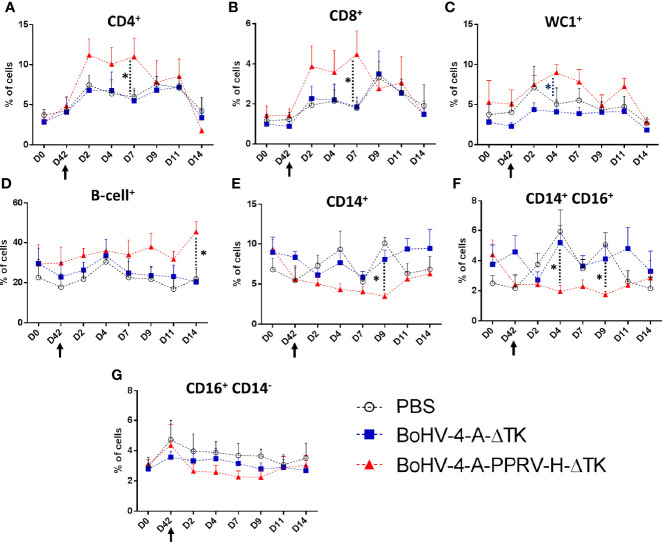
Figure 8.
Effect of BoHV-4-A-PPRV-H-ΔTK vaccination in ovine PBMC populations. PBMCs obtained from the three treatment groups [PBS (black), BoHV-4-A-ΔTK (blue), and BoHV-4-A-PPRV-H-ΔTK (red)] were stained with different monoclonal antibodies and analyzed by flow cytometry at different time points [pre-immunization (D0), pre-challenge (D42), and days 2, 4, 7, 9, 11, and 14 post-challenge (PC)]. Average percentage of (A) CD4+ cell population, (B) CD8+ cell population, (C) WC1+ (γδ T cell) population, (D) B-cell+ population, (E) CD14+ cell population, (F) CD14+ CD16+ cell population, and (G) CD16+ CD14− cell population for each sheep group were plotted. *p < 0.05 one-way ANOVA test (BoHV-4-A-PPRV-H-ΔTK vs. BoHV-4-A-ΔTK and PBS control groups). The black arrow (D42) denotes the time of virulent PPRV ICV’89 challenge in all animals.

