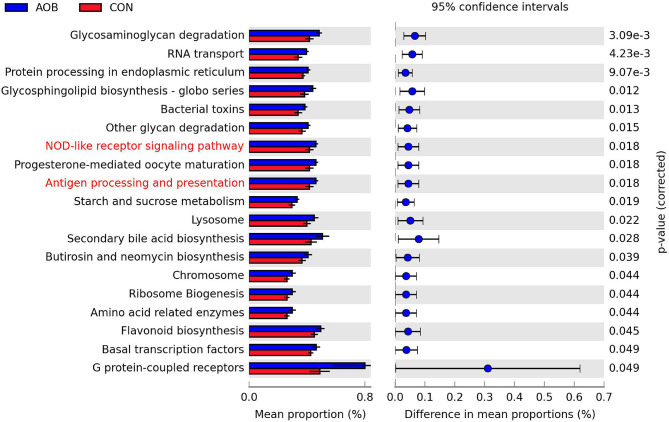
Figure 4.
Significantly different abundance of 19 KEGG pathways (level III) of predicted microbial functional composition from 16s rRNA sequencing data with PICRUSt between two groups (n = 6). Highlight KEGG (Red) related to the metabolism (level I). The extended error bar plot was generated using STAMP software. Welch's two-sided test with FDR correction, p < 0.05. KEGG, Kyoto encyclopedia of genes and genomes.

