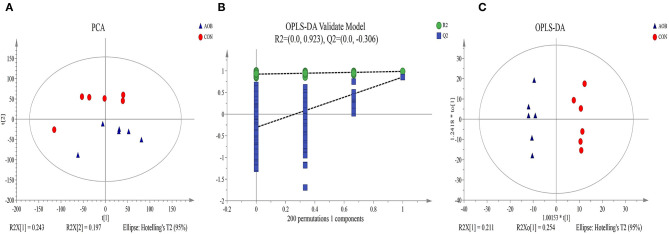
Figure 5.
Principal component analysis (PCA) score plot (A), permutation test plot (B), and orthogonal partial least-square discriminant analysis (OPLS-DA) (C) of the CON and AOB groups based on the milk metabolites profiles. The percentage variation in the plotted principal components is marked on the axes. Each spot represents one sample, and each group of milk samples is indicated by a different color. CON, red circle; AOB, blue triangle.

