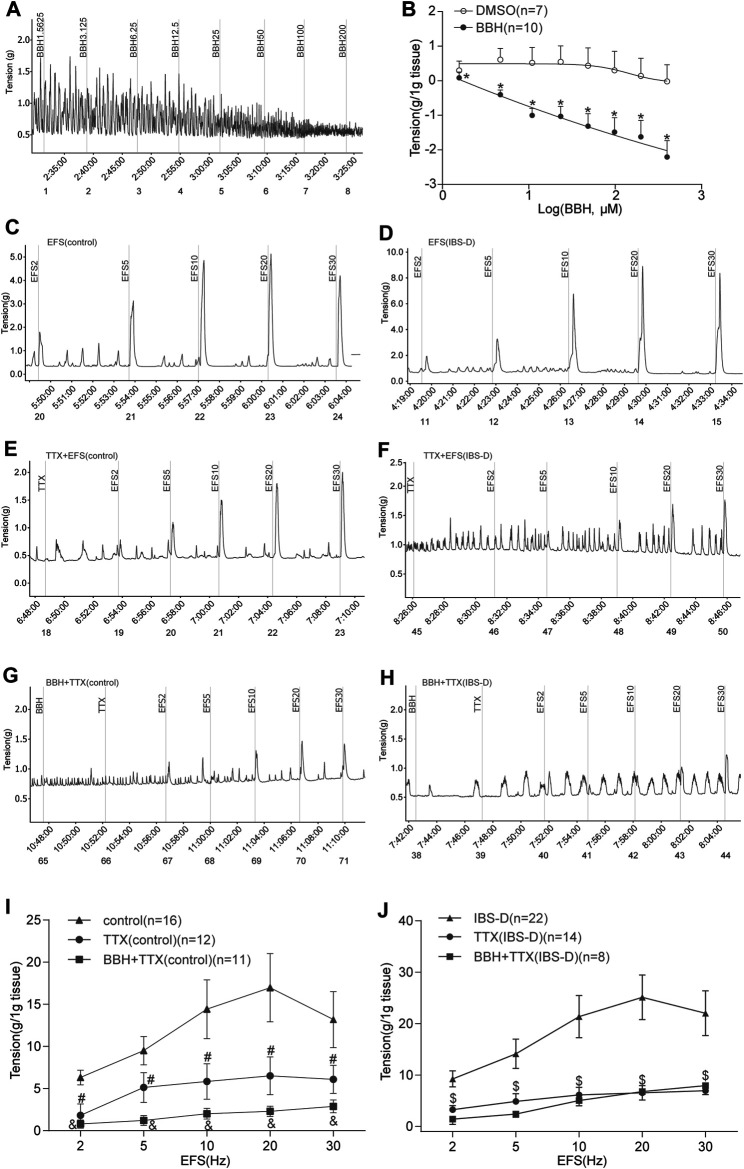
FIGURE 5.
BBH inhibited spontaneous and EFS-induced contractions of TTX-treated isolated colonic longitudinal smooth muscle. (A,B) Mechanical recording and linear regression curve of the cumulative log concentration–response of the effect of BBH (1.5625–200 μmol L−1) on the spontaneous contractions of the isolated colonic longitudinal smooth muscle. The EC50 of BBH was 25.17 μmol/L. DMSO had no effect. *denotes p < 0.01 compared with the vehicle DMSO group. BBH: n = 10, DMSO: n = 7. (C–J) Mechanical recording (C–H) and histogram (I–J) of the effect of TTX and BBH + TTX treatments on the EFS-induced contraction response of colonic longitudinal smooth muscle in the control and IBS-D groups. (C): EFS-induced control group (n = 16). (D): EFS-induced IBS-D group (n = 22). (E): TTX-treated control group (n = 12). (F): TTX-treated model group (n = 14). (G): BBH + TTX-treated control group (n = 11). (H): BBH + TTX-treated IBS-D group (n = 8). (I): BBH inhibited EFS-induced contractions of TTX-treated colonic tissues in the control group. # denotes p < 0.05 compared with the EFS-induced control group & denotes p < 0.05 compared with the TTX-treated control group. (J): BBH inhibited the EFS-induced contractions of TTX-treated colonic tissues in the IBS-D group. $ denotes p > 0.05 compared with the EFS-induced IBS-D group. Error bars represent mean ± SEM.

