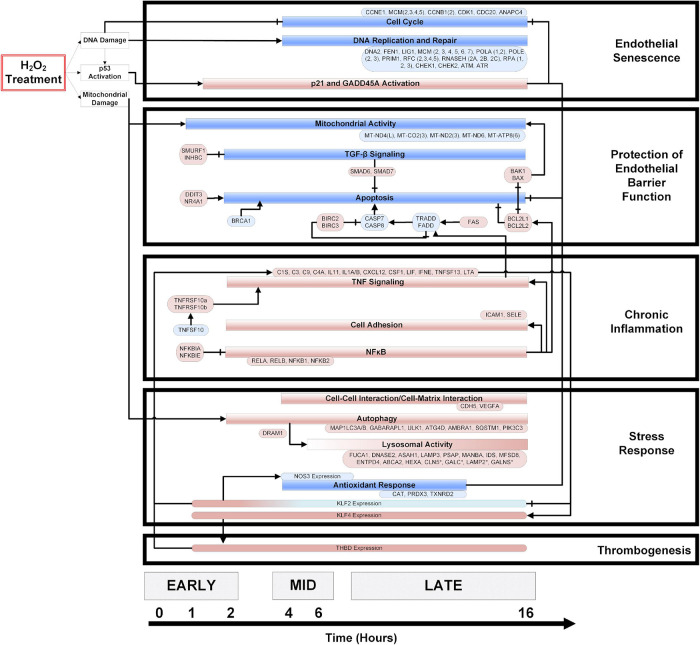
FIGURE 2.
A temporal model of HP induced oxidative stress in HUVECs. HUVECs treated with 0.5 mM HP in duplicate, and mRNA samples (from 0 to 16 h) were sequenced. Significantly regulated genes and cellular processes (p < 0.05) were used to construct a temporal model depicting oxidative stress response time-course. The boxes colored in blue and red represent down- and up-regulated genes or processes, respectively. The axis at the bottom of the figure indicates the time at which various processes become significantly regulated. An arrowhead depicts positive regulation, and a flat line indicates negative regulation. Vascular phenotypes associated with each group of genes/processes (i.e., endothelial senescence, protection of endothelial barrier function, chronic inflammation, stress response, and thrombogenesis) are indicated to the right of the temporal model. The log2 (fold-change) values for the genes specified in this model are summarized in the Supplementary Figure 3.

