FIGURE 4.
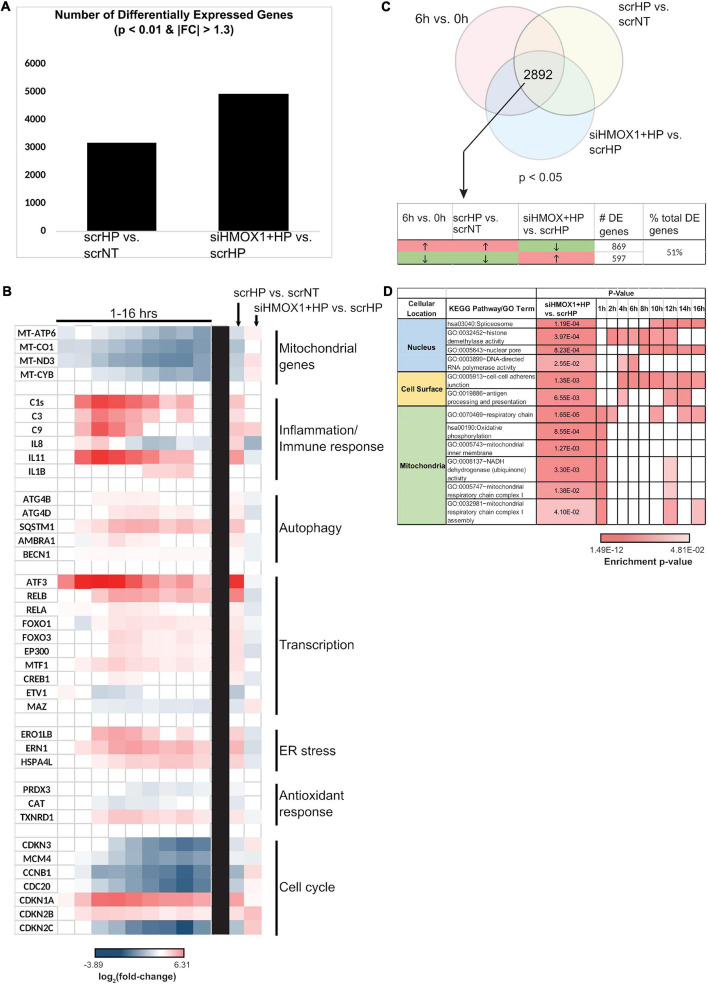
HMOX1 is a global regulator of cell function in HUVECs upon HP treatment. RNA collected from scrNT, scrHP, and siHMOX1+HP samples (n = 2 per group) was submitted for RNA-seq. (A) The number of differentially expressed genes between scrHP vs. scrNT (i.e., indicating the effect of the HP treatment) and between siHMOX1+HP vs. scrHP (i.e., indicating the effect of the HMOX1 knockdown in response to HP treatment). (B) Log2 (fold-change) of genes associated with mitochondrial function, inflammatory/immune response, autophagy, transcription, ER stress, anti-oxidant response, and cell cycle in the time-course data (to the left of the black bar) and the knockdown experiment (to the right of the black bar). (C) The Venn diagram indicates the number of overlapping differentially expressed genes between the time-course experiment and the knock-down experiment (i.e., the 6 vs. 0 h time-course data and the treatment groups; p < 0.05). The table indicates the number and percentage of overlapping genes that switch the direction of expression upon HP treatment in HMOX1 deficient HUVECs. (D) KEGG and GO enrichment analysis of the overlapping genes that switch their direction of regulation upon HP treatment in HMOX1 deficient HUVECs. Enrichment of pathways in the time-course data is also shown. The cell’s color indicates the significance of the p-value (the lighter the shade, the less significant, and the darker the shade, the more significant the p-value). The enriched KEGG pathways and GO terms were grouped into three spatial categories, as specified in the table’s first column.

