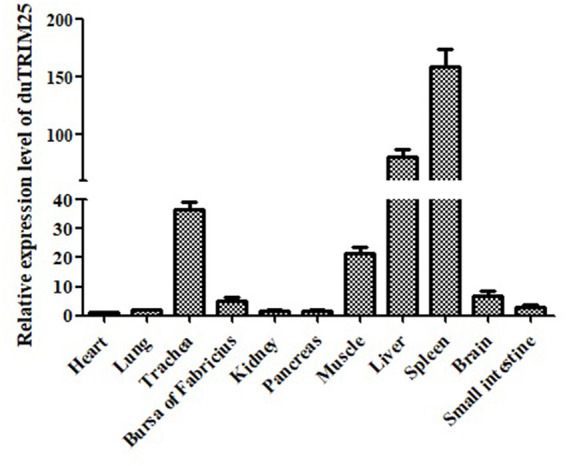
Figure 2.

Relative expression levels of duTRIM25 in healthy ducks. The transcription levels of duTRIM25 in different tissues were measured by quantitative real-time PCR. GAPDH was used as the control gene. Data were analyzed using GraphPad Prism software, and the results are means ± SD of three independent experiments.
