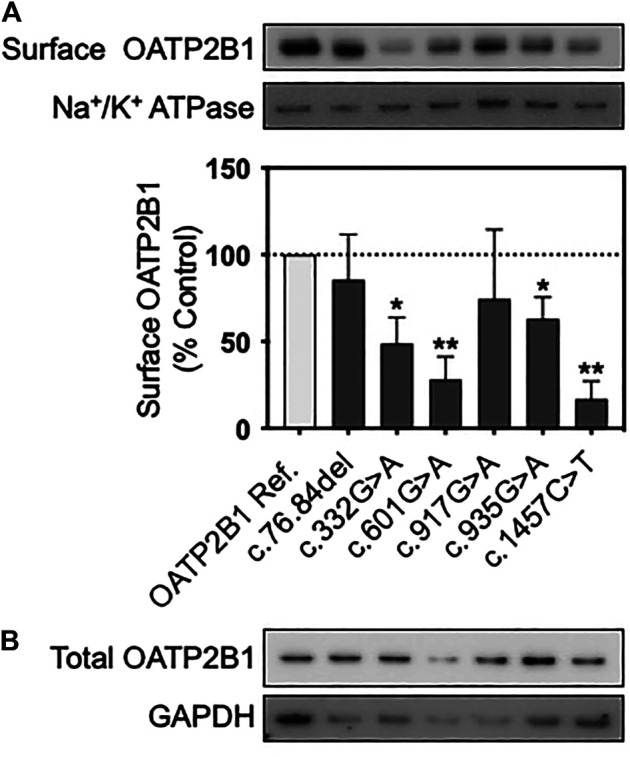
FIGURE 3.

Protein expression of OATP2B1 genetic variants. Representative western blots of (A) cell surface and (B) total OATP2B1 protein expression in HEK293T cells transfected with OATP2B1 reference and OATP2B1 genetic variants. Western blot analysis of surface OATP2B1 protein expression was normalized to Na+/K+ ATPase. Results are shown as mean ± SEM (n = 3), *p < 0.05, **p < 0.01.
