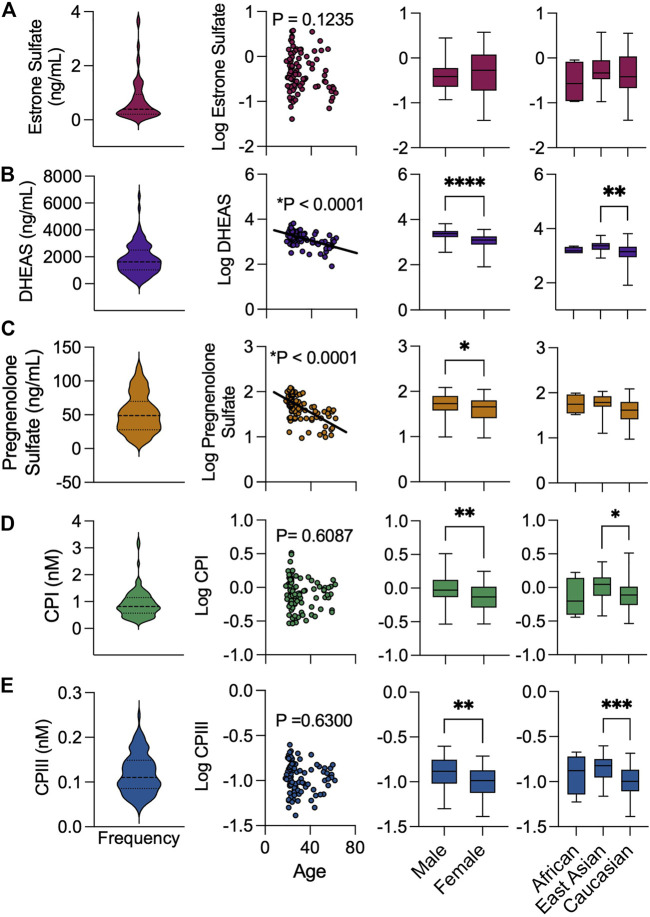
FIGURE 4.
Cohort distribution of endogenous biomarkers levels by baseline demographics. Frequency distribution of (A) estrone sulfate, (B) DHEAS, (C) pregnenolone sulfate (D) CPI and (E) CPIII. Association of endogenous substrates with age, sex, and ethnicity. Box and whiskers plots are shown as mean (line), 25th and 75th percentile (box) and range (whiskers) *p < 0.05, **p < 0.01, ***p < 0.001, ****p < 0.0001.

