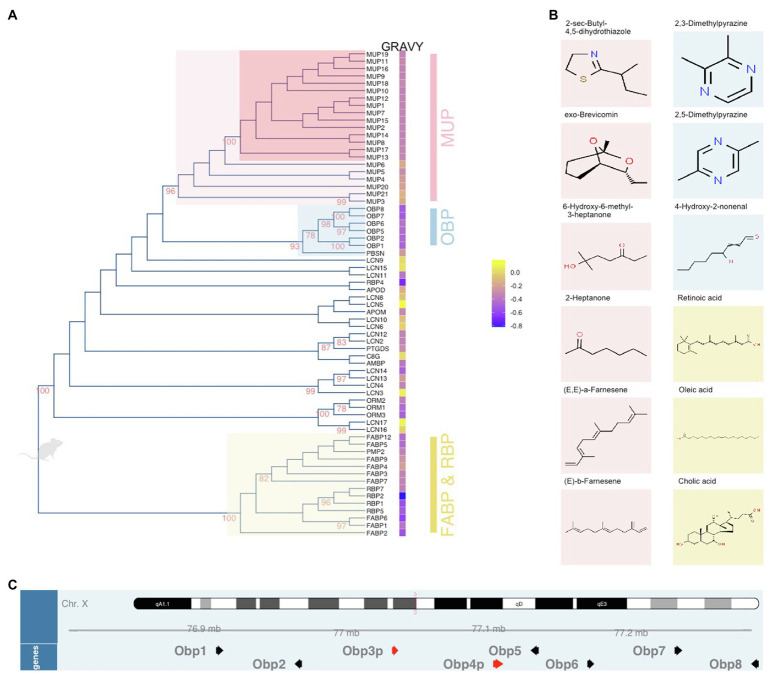
Figure 1.
Unrooted dendrogram of mouse lipocalins within the Calycin superfamily. The evolutionary history was inferred by using the Maximum Likelihood method based on the JTT matrix-based model. The tree (A) with the highest log likelihood (−17,639.2427) is shown. The percentage of trees in which the associated proteins clustered together is shown next to the branches. Initial tree(s) for the heuristic search were obtained by applying the Neighbor-Joining method to a matrix of pairwise distances estimated using a JTT model. The tree is drawn to scale, with branch lengths measured in the number of substitutions per site. The analysis involved 66 amino acid sequences. There were a total of 406 positions in the final dataset. Evolutionary analyses were conducted in MEGA6 while the final figure was plotted with ggtree. Next to the tree, Gravy index is scaled from blue (hydrophilic) to yellow (hydrophobic). The colour code of highlighted subtrees is also used (B) to highlight the most common ligands with high affinities to particular protein groups. The position of Obp genes (black arrows) and pseudogenes (red arrows) on the X chromosome is visualized in (C) using Gviz Bioconductor package.

