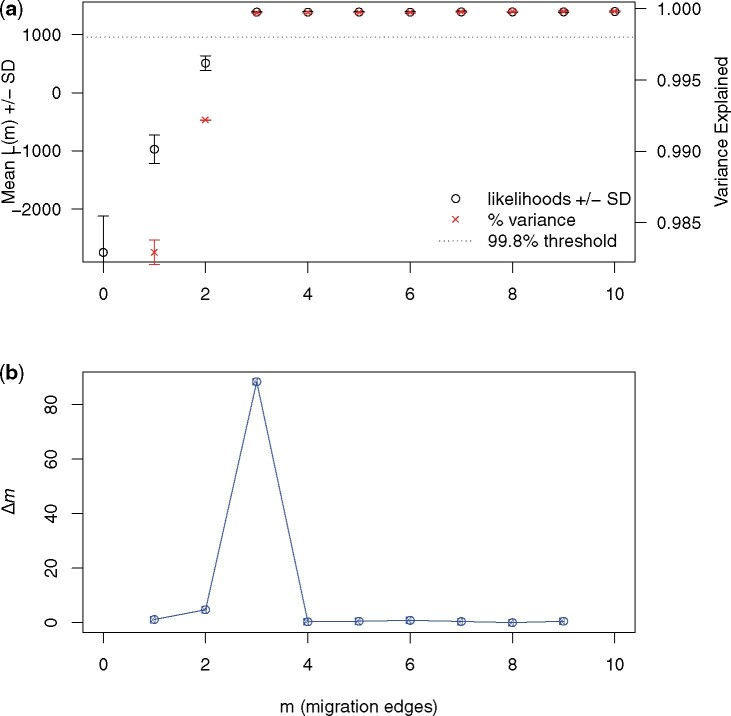
Figure 1:
The output produced by OptM for the simulated dataset with m = 3 migration edges. (a) The mean and standard deviation (SD) across 10 iterations for the composite likelihood L(m) (left axis, black circles) and proportion of variance explained (right axis, red “x”s). The 99.8% threshold (horizontal dotted line) is that recommended by Pickrell and Pritchard [2]. (b) The second-order rate of change (Δm) across values of m.

