Figure 2:
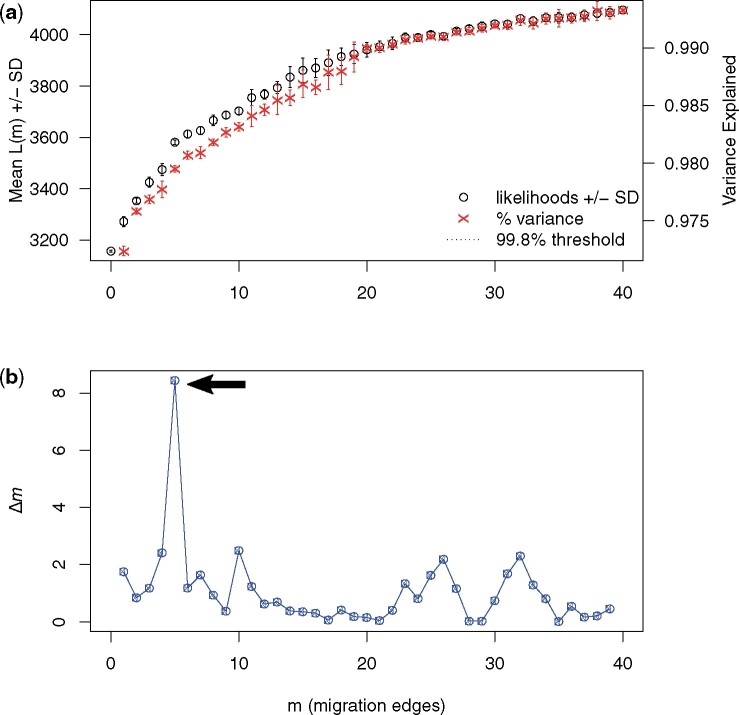
The output produced by OptM for an empirical dataset of domestic dogs. A total of 10 iterations were run for each possible number of migration edges, m = 1–40. (a) The mean and standard deviation (SD) for the composite likelihood L(m) (left axis, black circles) and proportion of variance explained (right axis, red “x”s). The 99.8% threshold is that recommended by Pickrell and Pritchard [2], but not visible here because the threshold is still not met at m = 40 edges. OptM produces a warning to notify the user that this threshold is not visible. (b) The second-order rate of change (Δm) across values of m. The arrow indicates the peak in Δm at m = 5 edges.

