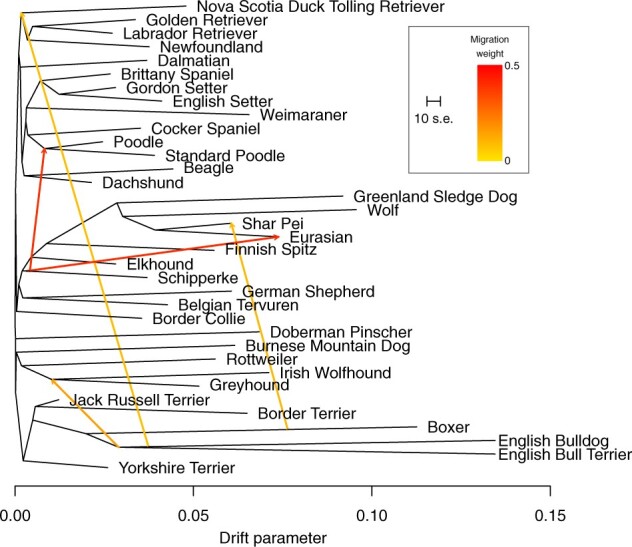
Figure 3:

The tree structure of the graph inferred by Treemix for the 34 dog breeds and gray wolf populations. Five migration edges were allowed as inferred by OptM. The migration edges are colored according to their weight (). The scale bar indicates ten times the average standard error of the values in the covariance matrix.
