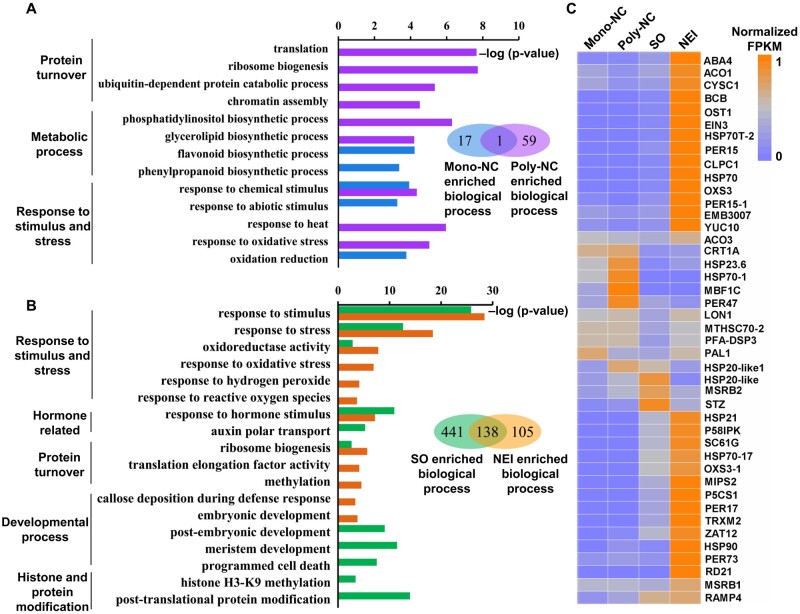
Figure 3.
Analysis of transcriptomes in apomictic and sporophytic cells. Enriched GO terms (biological processes) among differentially expressed genes (DEGs) between apomictic and sporophytic cells at earlier (A) and later (B) stages of NEI cell development. (C) Heatmap of 43 selected genes that are up-regulated in apomictic cells and associated with the GO term ‘response to oxidative stress’. The orange-to-blue scale indicates gene expression levels. orange = most, grey = moderate, blue = least. Poly/Mono-NC, poly/mono-embryonic nucellar tissue.

