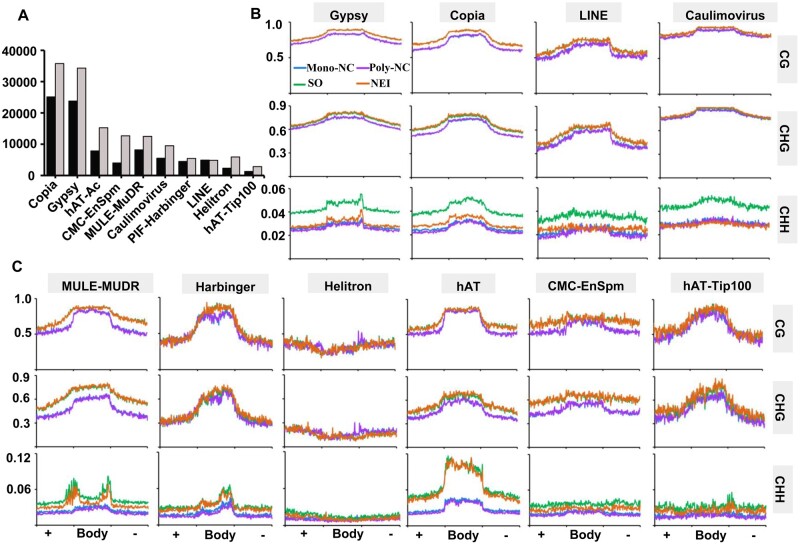
Figure 6.
Comparison of DNA methylation levels in different classes of TEs during the initiation of nucellar embryogenesis. (A) Categories and numbers of TEs identified in Clementine mandarin (C. clementina, black columns) and pummelo (C. grandis, grey columns) genomes. Average distribution of DNA methylation levels in Class I (B) and Class II (C) TEs. In all cases, the TE flanking regions are of the same length as the TE bodies. +, Body, −, the upstream, body and downstream regions of TEs; methylation levels were calculated in 100 proportionally sized bins. Poly/Mono-NC, poly/mono-embryonic nucellar tissue.

