Figure 6.

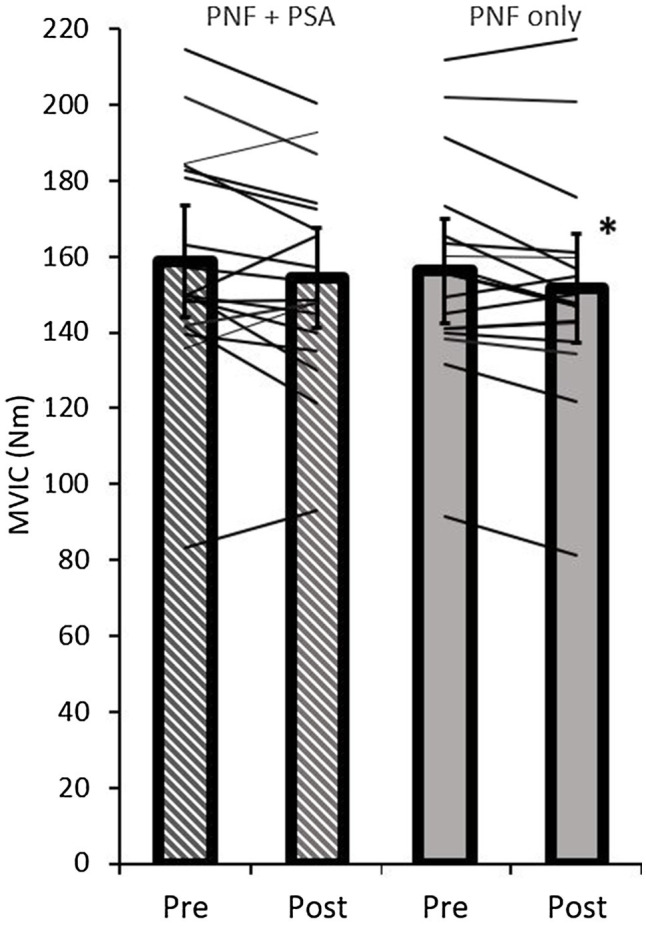
Pre- and post-MVIC peak torque values of both groups (PNF only and PNF+PSA) and the individual changes. *=significant change between pre- and post-values.

Pre- and post-MVIC peak torque values of both groups (PNF only and PNF+PSA) and the individual changes. *=significant change between pre- and post-values.