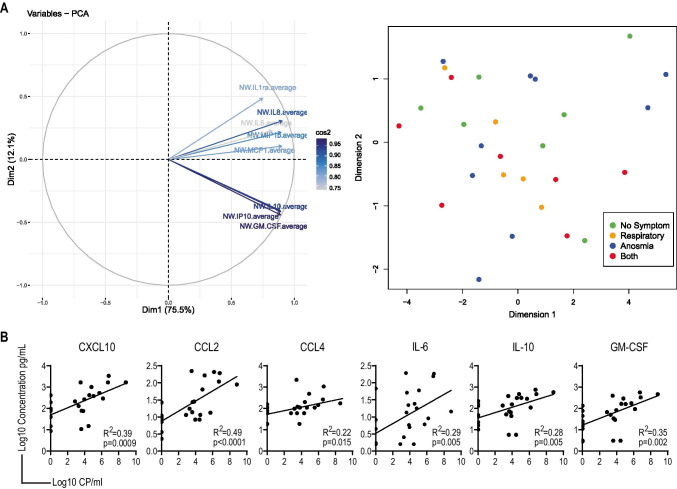
Fig. 3.
Correlation between local cytokines, symptoms, and viral load. A A principal component analysis was performed on cytokines measured in nasal wash, PC1, and PC2 are represented (right). The symptoms at time of sample collection were then overlaid on PC1 and PC2. No specific correlation was observed (left). B Correlation analysis between nasal wash cytokines and viral load measured in the same samples, both were log10 transformed to test the correlation; each panel shows R2 value and p value. Cp copies

