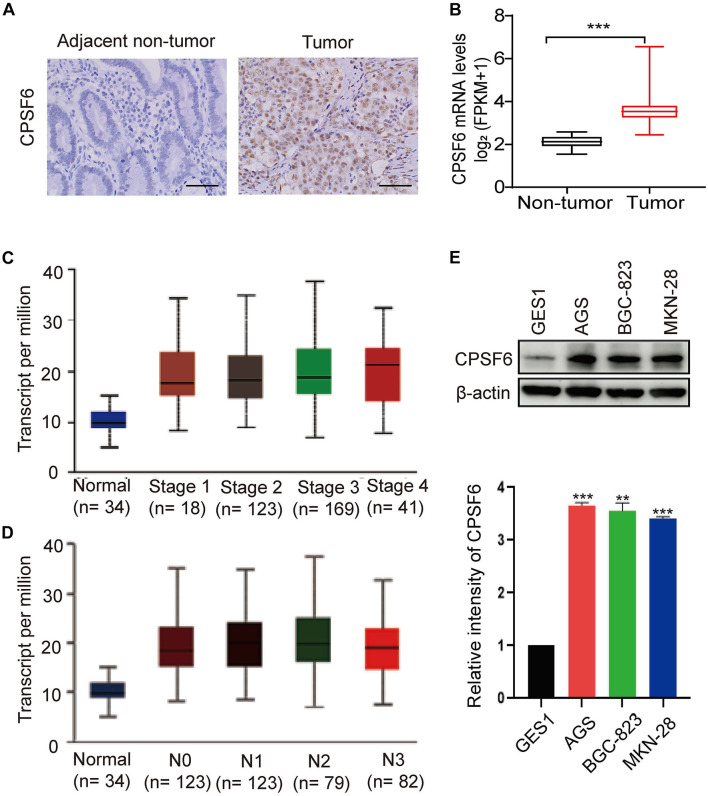
FIGURE 1.
Expression of CPSF6 was upregulated in GC. (A) The IHC staining assay of CPSF6 in GC and adjacent tissues of the tumor (scale bar: 100 μm). (B) Analysis of CPSF6 mRNA levels of GC (n = 352) and non-tumor tissues (n = 32) in TCGA. (C) Expression of CPSF6 in GC based on individual cancer stages in TCGA. (D) Expression of CPSF6 in GC based on nodal metastasis status in TCGA. (E) Western blot assay for detecting CPSF6 expression in different cell lines. **0.001 < p < 0.01; ***p < 0.001.

