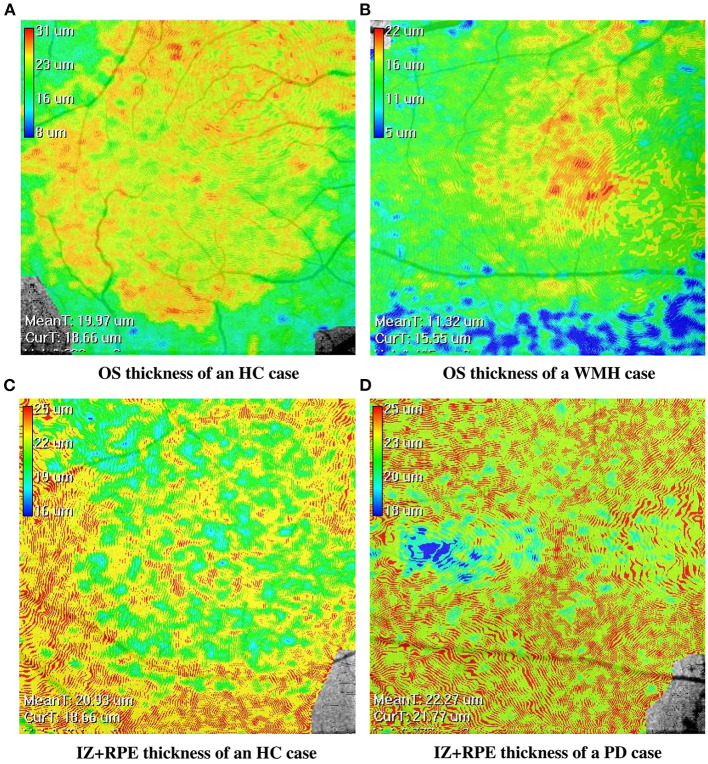
Figure 4.
The en-face retinal layer thickness maps of four cases from the WMH, PD and HC groups, respectively. (A,B) show the thickness distribution difference of the OS layer between the HC and WMH groups. (C,D) show the thickness distribution difference of the IZ+RPE layer between the HC and PD groups.

