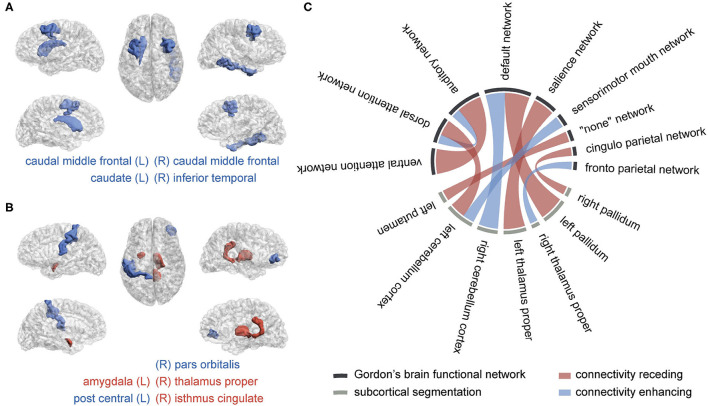
Figure 3.
The brain regions and connectivity associated with attention-deficit/hyperactivity disorder (ADHD). (A) Macrostructural abnormal regions, (B) microstructural abnormal regions, and (C) abnormal functional connectivity The blue color represents a lessened measure in the ADHD group, while the red color represents a strengthened one. The more frequently they are picked in the selection procedure, the wider their bonds are.

