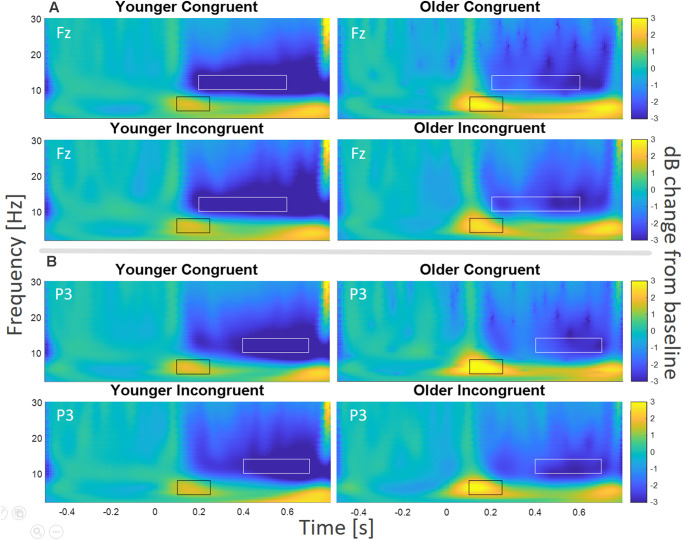
Figure 5.
TF Analysis for electrodes (A) Fz and (B) P3. For Fz, the theta frequency band (black rectangles) was analyzed from 4 to 8 Hz, from 100 to 250 ms, and the alpha frequency band (white rectangles) was analyzed from 10 to 14 Hz, from 200 to 600 ms, for young and older participants. For electrode P3 theta (black rectangles) was analyzed from 4 to 8 Hz, from 100 to 250 ms, and alpha (white rectangles) was analyzed from 10 to 14 Hz, from 400 to 700 ms, for young and older participants.

