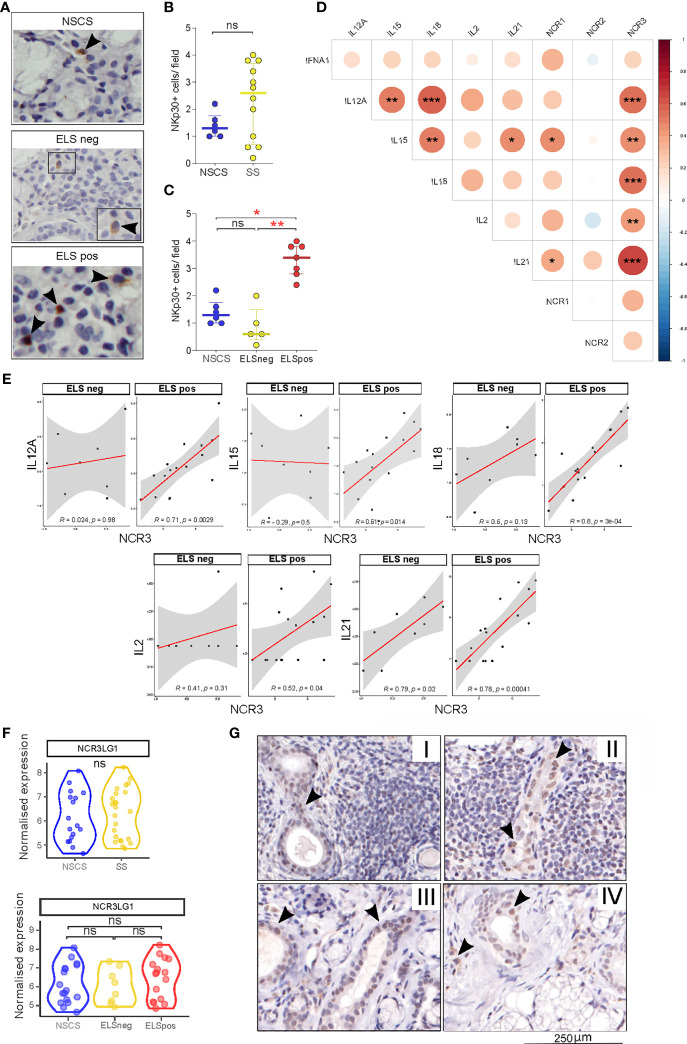
Figure 2.
NKp30 and B7/H6 localization in salivary gland tissues. (A) Representative images of immunohistochemistry staining for NKp30 in NSCS (n = 6) and SS (n = 12) labial salivary gland biopsies. Arrowhead: NKp30+ cells. (B, C) Quantification (mean count per field) of NKp30+ cells in labial SG biopsies of NSCS and SS (B), segregated by the presence of ELS (C). Mann–Whitney U t-test statistics in (B) and Kruskal–Wallis test with Dunn’s multiple comparison correction (C). All graphs represent median with interquartile range. *p < 0.05, **p < 0.01, ***p < 0.001. (D) Correlation matrix between NCR1 (NKp46), NCR2 (NKp44), and NCR3 (NKp30) with IL12A, IL15, IL18, IL2, and IL21 gene expression levels from bulk-RNA sequencing of SG tissues. Graph shows NSCS (n = 17) and pSS (n = 24) patients. Spearman correlation coefficient, R (color denotes the strength of the correlation) and p-value, FDR correction for multiple comparison. *p < 0.05, **p < 0.01, ***p < 0.001. (E) Spearman correlation analysis between NCR3 with IL12A, IL15, IL18, IL2 and IL21 in pSS patients (n = 24) segregated by the presence of ELS. Spearman correlation coefficient, R and p-value, *p < 0.05, **p < 0.01, ***p < 0.001. (F) NCR3LG1 (B7/H6) gene expression level in NSCS (n = 17) and pSS (n = 24) salivary glands (top graph), and NSCS with pSS segregated by the presence (ELS pos) or absence (ELS neg) of ectopic lymphoid structures within SG (bottom graph). Mann–Whitney U t-test statistics and Kruskal–Wallis test with Dunn’s multiple comparison correction respectively. (G) Representative images of immunohistochemistry staining for B7/H6 in labial salivary gland biopsies of SS with different degrees of inflammation (I, II, and III) and NSCS (IV). Arrowhead: B7/H6 + cells. ns, not significant.

