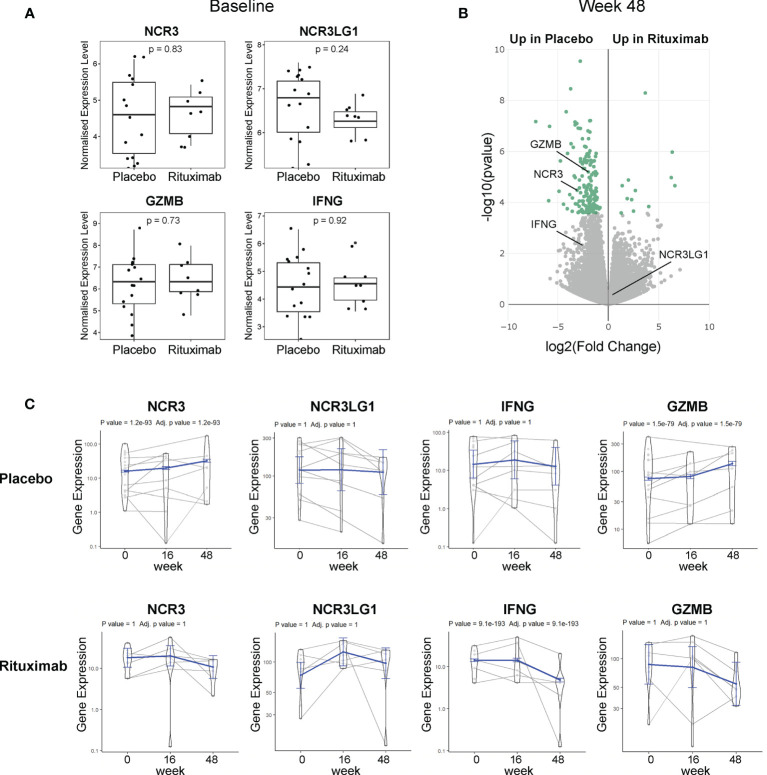
Figure 4.
NKp30 and B7/H6 expression post-Rituximab treatment. (A) Baseline expression of NCR3 (NKp30), NCR3LG1 (B7/H6), GZMB, and IFNG between placebo and rituximab salivary glands. Mann–Whitney U t-test statistics. (B) Volcano plot of DEGs using DESeq2 comparing rituximab versus placebo patients after 48 weeks of treatment. Comparison between groups using Wald test and correcting for multiple testing Storey’s q-value (q < 0.05 = significant, shown in green). Positive values represent upregulation in rituximab and negative values denote downregulation in rituximab-treated patients compared to placebo. (C) Longitudinal analysis fitting a mixed effects linear model of NCR3, NCR3LG1, IFNG, and GZMB genes for rituximab (21 samples, 10 individuals) and placebo (29 samples, 15 individuals). The scatter plot shows the assessed normalized expression level of each sample over time overlaid by the fitted model (in blue) with 95% confidence intervals (fixed effects).

