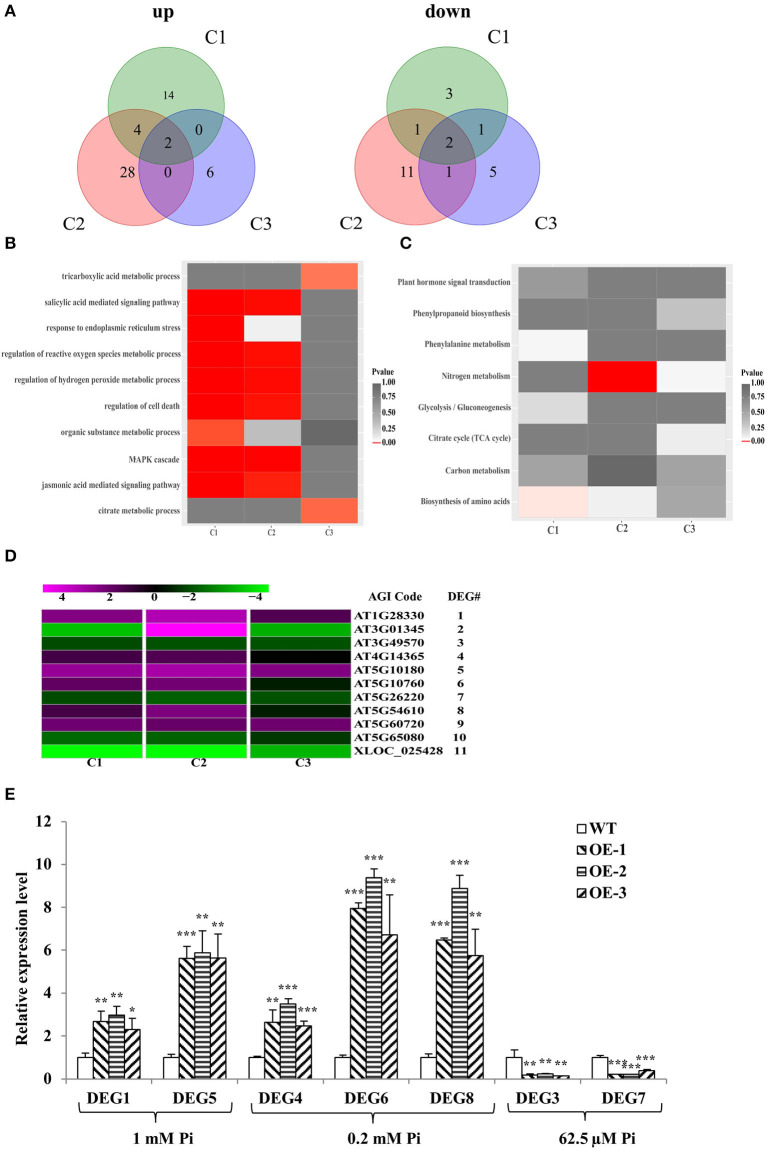
Figure 5.
RNA-seq analysis and RT-qPCR verification. (A) Venn diagrams of all genes exhibiting upregulated or downregulated expression between WT and GmWRKY46-overexpressing Arabidopsis plants. C1, C2, and C3 represent different levels of Pi. (B,C) Results of the GO enrichment analysis (B) and KEGG pathway enrichment analysis (C) of the DEGs between WT and GmWRKY46-overexpressing Arabidopsis plants. (D) Heat map of clustering analysis of the 11 DEGs in the intersection of C1, C2, or C3. Expression ratios are shown as log2 values. Magenta represented increased expression; green represented decreased expression; black represented no difference in expression compared with control. (E) Expression patterns of 7 DEGs candidates. Vertical axis showed fold enrichment of relative transcript levels between transgenic and WT plants. Expression was normalized to that of Actin2/8. Data were means ± SD (n = 3). Data significantly different from the WT were indicated (Student's t-test, *P < 0.05, **P < 0.01, ***P < 0.001).

