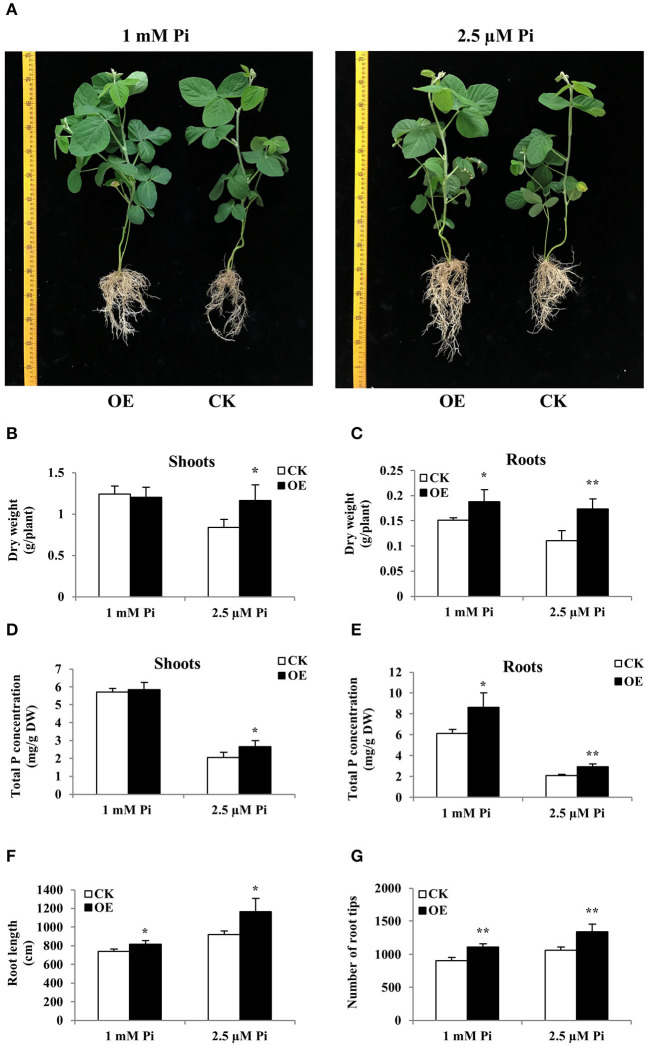
Figure 8.
Comparison of control (CK) and GmWRKY46-overexpressing composite soybean plants (OE) under two Pi level conditions. Composite soybean plants with transgenic hairy roots were transferred to a nutrient solution containing 1 mM Pi (Pi-sufficient) or 2.5 μM Pi (Pi-deficient). After a further 14 days, shoots and roots were separately harvested for analysis. (A) Phenotype of CK and OE. Scale unit: cm. (B) Dry weight of shoots. (C) Dry weight of roots. (D) Total P concentration of shoots. (E) Total P concentration of roots. (F) Root length of composite plants. (G) Number of root tips of composite plants. CK represents the composite plants transformed with the empty vector; OE indicates composite plants with GmWRKY46-overexpressing transgenic hairy roots. DW means dry weight. Data are means ± SD of three biological replicates. Asterisks indicate significant differences between OE and CK (Student's t-test, *P < 0.05; **P < 0.01).

