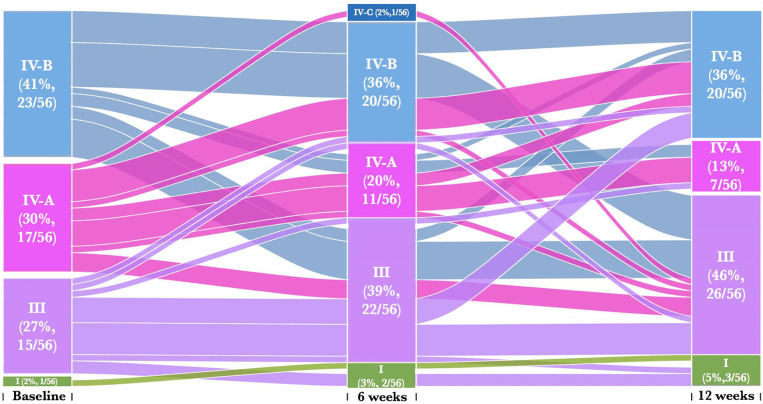
Figure 3.
Alluvial diagrams are showing participant transition (n=56) between CSTs pre- and post-treatment. CST I (green) lacked a consistent dominant species, but all communities included L. crispatus, CST III (purple) L. iners dominance, CST IV-A (pink) had diverse bacterial communities dominated by BVAB1, CST IV-B characterized by G. vaginalis dominance and CST IV-C characterized by an even community with moderate abundance of Prevotella bivia.

