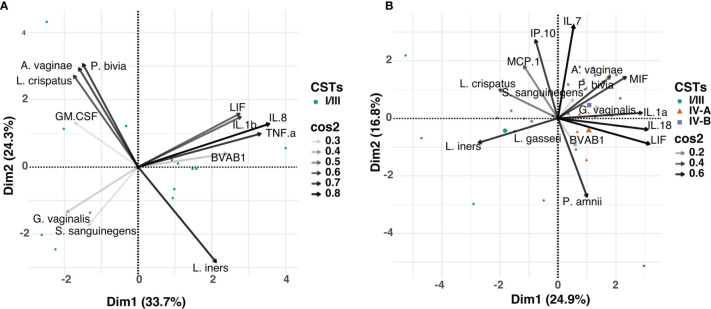
Figure 5.
Principal component analysis (PCA) showing the relationship between the relative abundance of the individual bacterial taxa and mucosal cytokines associated with BV, in: (A) women that cleared BV at 12 weeks post-treatment (n=13), and (B) those that had persistent BV (n=35). Data points represent the projection of participants on PCs 1 and 2 with colour and shape corresponding to their respective CST assignment. The arrows correspond to eigenvectors, which give a sense of the magnitude of the factors in the data set that drive the separation. The arrow length indicates the variance across the dataset and the angle between the arrows describes the correlation between the variables. The cos2 value of the variable indicates its contribution in driving the input data into principal components. Variables with large cos2 values contribute more to the distance separating the data points in the PCA.

